By Jack Corgel, Ph. D. and Ryan Speed
How the future profitability of U. S. hotels may be influenced by simultaneous improvement of labor market conditions and increasing inflation is the subject of this edition of Hotel Currents™. A narrowing of the gap between the demand and supply of labor, as evidenced by the declining unemployment rate usually results in upward pressure on wages as should the ongoing political actions to elevate minimum wages. Wage growth has been sluggish during the recovery from the Great Recession. However, Moody’s Analytics chief economist Mark Zandi recently stated in a company report that “a pickup in wage growth appears imminent”.
Accelerating wage growth raises the possibility of inflation elevating above the current level. Noteworthy increases in wages and inflation over the next few years represent opposing financial forces for determining future hotel cash flows. Labor costs constitute up to nearly one-half of the total expense in U.S. hotels. Because room rates are regularly reset, hotel management possesses a natural hedging instrument for battling inflation while coincidently countering the negative effects of increasing labor costs on hotel cash flows. How will these macroeconomic cross currents influence future hotel financial performance?
U.S. LABOR MARKET CONDITIONS
Although unemployment rates registered relatively high percentages during the Great Recession and early recovery stages, the recent downward trend in the unemployment rate indicates a strengthening of the U.S. labor market. As an indication of a stronger labor market in the future, Moody’s Analytics forecasts national employment levels to grow for the sixth consecutive year, from 1.7% in 2013 to 2.3% in 2015. Employment appears to be nearing equilibrium given the current size of the labor force.1 Economists at the Federal Reserve Bank of St. Louis estimate that the natural rate of unemployment stands at 5.5%, the current level reported by the U.S. Bureau of Labor Statistics.
MARKET AND REGULATED WAGES
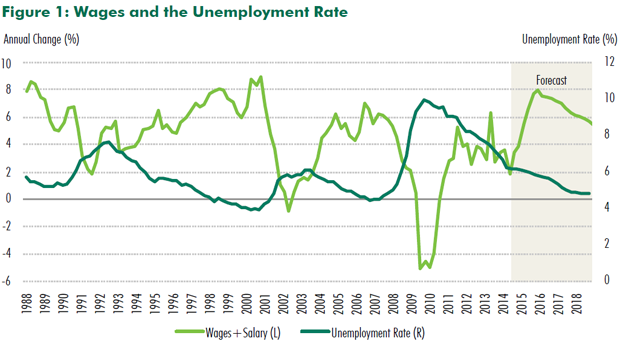
Figure 1 charts the movement of the unemployment rate with average national hourly pay. The annual percent change in wages has a decidedly inverse relationship to the national unemployment rate. The figure shows that during 2014 wages were increasing at an accelerating rate while the unemployment rate (UER) declined.
The unusual stickiness of wage growth following the gradual decline in the unemployment rate during the recent economic recovery remains a topic of discussion among economists. Federal Reserve economists Daly and Hobijn show that lower than expected wage growth is the result of the less than normal wage cuts during the recession. Others argue that real wages are now growing at expected rates given the low inflation the U.S. has been experiencing.2 That is, wages should grow at the inflation rate plus the rate of labor productivity growth. Figure 1 shows a noticeable pickup to over six percent in nominal wage growth by year-end 2015.
Another possible driver of nominal wage growth is political involvement in the U.S. labor market which manifests in the enactment of laws and imposition of rules to raise minimum wage levels.3 When political pressures produce minimum wage increases, total hourly wage levels rise in all markets.4 Figure 2 shows how the wage increases brought on by political influence relate to the wage increase trend since the late 1980s.
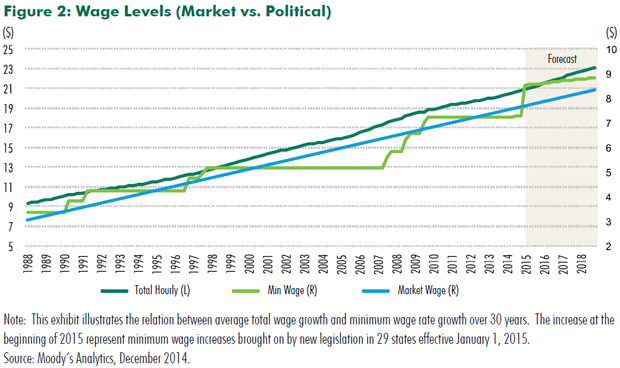

As indicated by the similar slopes of the linear trends in Figure 2, upward movements in the minimum wage despite occurring in steps at discrete points in time, have grown at virtually the same rate over the past several decades as market-determined wages; it appears that minimum wage laws follow the market.
IT MATTERS HOW WORKERS SPEND WAGE INCREASES
Changes in personal income resulting from changes in wages strongly influence consumer spending during normal periods, that is, when fear or uncertainty are not driving consumers to disproportionately save. Figure 3 presents the movement of U.S. consumption as annual percent change since 1988.
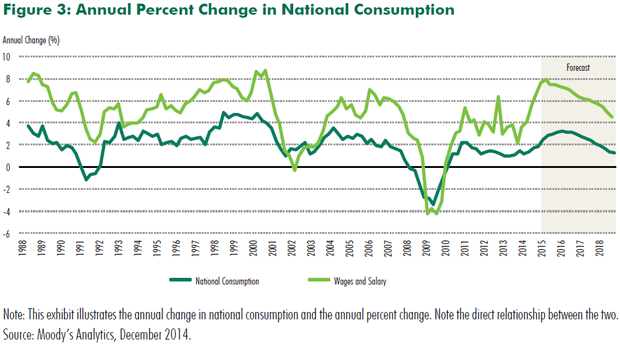
Wage growth and unemployment levels from Figure 1, when compared to the consumption growth rate in Figure 3, indicate that the more wage and salary growth exceeds the unemployment rate, the greater the growth in national consumption relative to saving. National consumption growth is forecast to peak at 4.1% in 2016, while the growth in wages is forecast to peak in 2015 at 8.0% (Figure 1). The takeaway being that the high marginal propensity to consume resulting from accelerating wage growth will likely impact nominal and real hotel financial performance in positive ways, given that the majority of hotel stays in the U.S. are consumption related.
PHILLIPS CURVE INTERPRETATIONS OF UNEMPLOYMENT AND INFLATION RELATIONSHIP
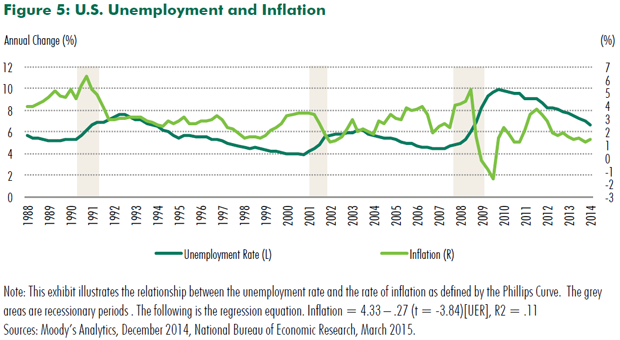
The larger macroeconomic question about accelerating wages is: how much inflation might higher wages produce? The downward sloping, nonlinear trace of unemployment and inflation rates known as the Phillips Curve originated from repeated statistical analyses of different countries’ historical data. This empirical artifact created a policy debate as to whether central government actions designed to raise the inflation rate may actually lower unemployment. Detailed analyses revealed that inflationary policies may have the intended effect in the short run, but not over an extended period as the labor market moved to the natural rate of unemployment. The short- and long-run relationships appear in Figure 4.
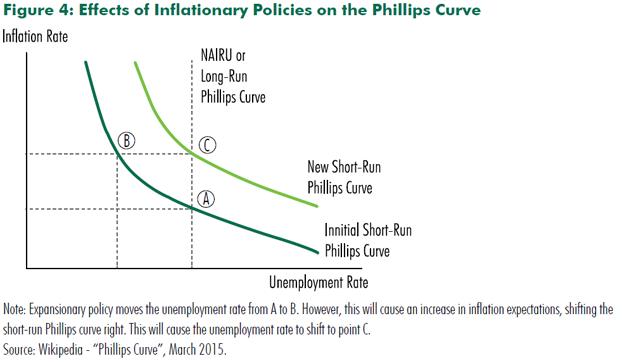
We reverse engineer the Phillips Curve for the purpose of demonstrating what might happen to inflation with the further projected decline in the unemployment rate as it approaches the natural rate. With improving economic conditions more workers find suitable jobs, leading to a lower unemployment rate. Assuming the supply of labor remains relatively fixed, an increase in the demand for labor causes the price of labor to go up. As workers earn increasingly higher wages, aggregate consumption rises. This process leads to a rise in the general prices level, assuming the Phillips Curve prediction is correct. The short-run inverse relationship between inflation and unemployment is apparent in Figure 5 even though the long-rung correlation is not high. While this relationship has been shown to weaken as the labor market moves toward the natural rate of unemployment and the spread between the current and nature unemployment rates is narrow, estimating the natural rate is not a certain science and most economist predict accelerating inflation and wage growth in late recovery.
HOTEL PROFIT CROSSCURRENTS
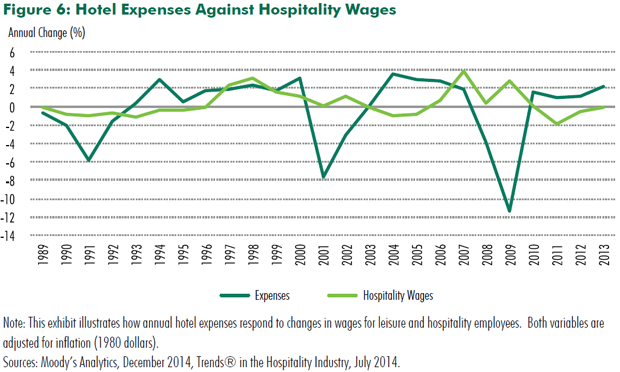
Tightening labor market conditions in the economy will encourage hotel management to accelerate searches for workers. The scarcity of labor available for hotel employment then results in wage increases as management attempts to attract the most experience workers. For many hotels, particularly full-service, convention, and resort properties, labor costs represent up to one-half of total operating expenses.5 Thus, meaningful increases in labor costs will negatively affect profits. Figure 5 charts the movement of the average wage rate for U.S. workers in the leisure and hospitality industry along with hotel expense levels. Not surprisingly, a strong positive correlation exists between hotel expenses and hospitality employee wage growth.
Higher hotel room average daily rates (ADRs) typically counter increases in labor costs during economic expansions. However, if ADR growth is stymied for some reason (e.g., excessive supply growth), profits will fall under the heavy weight of rising wages. Figure 6 shows that, except for periods when severe demand shocks had deleterious effects on ADRs, real increases in room rates occurred because the supply of hotel rooms was unable to keep pace with increasing demand, a phenomena referred to as delivery lag which is caused by long construction periods. With the exception of a few city markets, additions to supply will not threaten real ADR growth for a few more years.
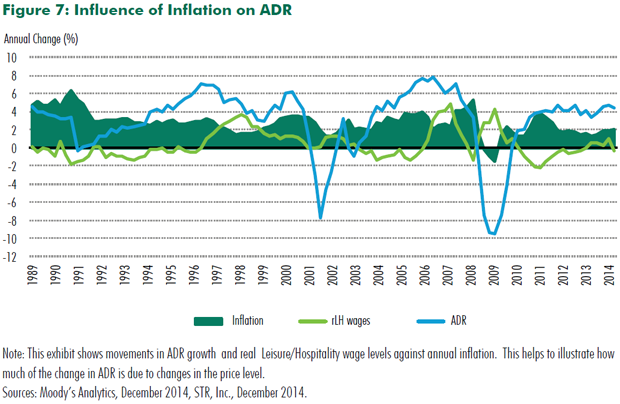
As often mentioned, hotels have the unique ability to quickly adjust prices of spaces relative to lease-intensive commercial property types. Because hotel management can change room rates with limited contract friction, changes in ADRs tend to move with and have exceeded inflation rates during most years since the early 1990s (Figure 7)6
REAL PROFIT PICTURE
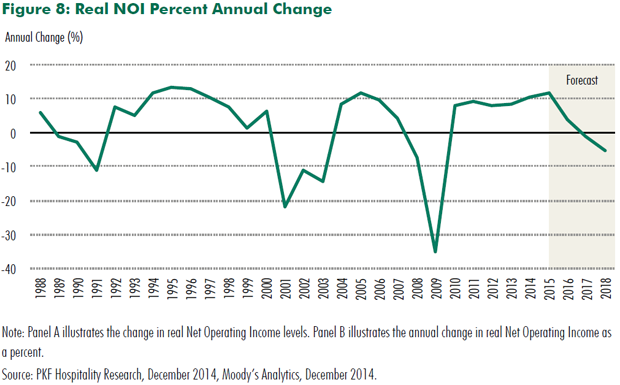
The historical evidence that ADR hedges inflation gives some assurances that hotel profit growth will not be severely compromised by a surge in hotel worker wages. Figure 7 provides a direct look at real profit levels and growth since the late 1980s.7 Both real NOI levels and growth rates are decidedly cyclical. Currently and for the foreseeable future, hotel NOI growth will persist in the double digits. Hotel NOI growth is forecasted to be 17.3%, 13.2%, and 10.1% in 2014, 2015, and 2016, respectively (Figure 8).
CONCLUSION AND FORECAST
An economic recovery from a severe recession, as experienced in the U.S. during 2009, brings about positive movements among many economic indicators. Interestingly, changes in measures of the component parts of the economic system are non-synchronous and each recovery has a different maturation pattern. The nation’s unemployment rate is approaching the natural rate and average annual GDP growth was positive for 2014, yet wage growth has been disappointing. An increasing number of economists now believe accelerating and sustained wage growth is about to occur. Obviously, the prospect of near-term wage growth is highly anticipated by workers. For producers in labor-intensive businesses, increasing costs of operations may severely compromise profitability. The salaries, wages, and benefits provided workers to operate U.S. hotels make up the largest portion of expenses for owners – an average of 44.8% of total costs.
Assuming that current projections for the next few years hold, owners will see the level of worker compensation noticeably increase and perhaps labor cost contributions to total costs rise. The double-digit forecast of profit growth will be realized even in the event of unexpected increases in labor costs for following three reasons:
- Revenue Growth – Economic expansion historically results in strong hotel real revenue growth – not only higher labor costs – as long as additions to supply lag demand growth. Current and near-term conditions indicate the threats to topline revenue growth in most hotel markets from overbuilding are minimal.
- ADR Inflation Hedge – The Phillips curve predicts that declining unemployment corresponds to increasing inflation. Hotel property wage growth in a tightening labor market following lower unemployment can be countered by hotel management adjusting nominal ADRs.
- Hotels Participate in Wages Growth – The majority of household wage increases will be allocated to consumption. Hotel services have an income elasticity of approximately 1.0.8 Some business travel may be forestalled, but leisure travel constitutes 70% of total domestic travel.9
Late-cycle wage growth is a ‘hotel current’ worth watching for its potentially negative influence on profits. Evidence supports the case that crosscurrents of the economic expansion will overwrite the effects of wage growth and generally push hotel profits in a decidedly positive direction, with double-digit profit growth forecasted over the next few years.
__________________
1 Despite a 0.2% annual decline in the labor force participation rate, the size of the labor force has grown by over 1.1 million jobs since November 2014 of last year, as reported by the Bureau of Labor Statistics. 2 Comment on Daly and Hobijn (2015) in www.ritholtz.com/blog/2015/why-is-wage-growth-so-slow/? 3 Historically, most states’ minimum wage levels have been lower than those dictated by federal minimum wage laws. However, due to increases recently mandated in many states’ legislation, 29 states have minimum wages laws above that of the federal minimum wage. See www.ncsl.org/research/labor-and-employment state-minimum-wage chart. 4 Research conducted by Harris and Kearny (2014) indicates that an increase in the national minimum wage could increase hourly wages for 35 million workers. 5 According to data from PKF’s Trends® in the Hotel Industry the following percentages of labor-to-total hotel expenses apply by market segment: Full service – 45.0%, Limited service – 35.4%, Resort – 47.6%, Convention – 47.7%, Suite 35.0% -38.2% and for all hotels – 44.8%. 6 Hotels that rely on group and convention business for which room rates are determined by annual contracts incur pricing friction similar to some leased real estate. 7 Hotel profit and net operating income (NOI) are financially synonymous. In Trends® in the Hotel Industry, 2014, ‘profit’ is defined as income after deductions for management fees, property taxes, and insurance, but before deductions for capital reserve, rent, interest, income taxes, depreciation, and amortization. 8 According to “Hotel Industry Demand Curves” (Corgel and Lane, 2012), the income elasticity for Upper Price hotels is 1.01. 9 U.S. Travel Association (2011) estimates that the number of domestic leisure trips is approximately three time the number of domestic business trips (1,516.8 million to 447.8 million in 2010).