?")
By David Eisen
In a previous blog post, I took aim at RevPAR. My pursuit: to puncture the long-held notion that it’s the most exemplary data point to consult within the hospitality industry. And, according to one comment, I succeeded in doing so (thank you, Don Weintraub, you made my mother very proud).
My thesis was not that RevPAR is obsolete; following it is still necessary, especially since RevPAR tracks revenue derived from the rooms department, the largest source of revenue for a hotel. It’s akin to tracking cap rates when investing in hotels—one data point but not the end-all. RevPAR (a combination of rate and occupancy) is easy to comprehend ; it’s like a batting average in baseball, which, during a broadcast, is flashed on the screen when a batter is at the plate. People get it!
Oh, but there is so much more! Why eat only vanilla when there are 31 flavors? Not only is Baskin-Robbins delicious (“31 Flavors” is its slogan), it makes for a useful segue. If hotel-related KPIs are as diverse as they are numerous, then total revenue per available room, or TRevPAR, is the rainbow-flavored ice cream of performance metrics. It takes into account the totality of revenue that a hotel brings in—including rooms, food and beverage, conference and banqueting, and other operated departments. The whole pie, if you will—and à la mode, in our example.
If hotel-related KPIs are as diverse as they are numerous, then total revenue per available room, or TRevPAR, is the rainbow-flavored ice cream of performance metrics.
TRevPAR is calculated by dividing the total net revenue of a property by its total number of available rooms. And as RevPAR is calculated by dividing the total room revenue of a property by its total number of available rooms, you can easily recognize the difference: RevPAR calculates revenue derived from rooms; TRevPAR calculates revenue from every nook and cranny. Therefore, it provides a view of the big picture, allowing for operational adjustments to be made accordingly.
Without question, full-service hotels are better positioned than select-service hotels to benefit from consulting and monitoring TRevPAR. That’s because a larger portion of revenue at select-service properties is derived from rooms, which, from a profitability standpoint, makes sense since that’s where margins are highest. More specifically, ADR-led RevPAR increases are notably better than those that are occupancy-led, since the former doesn’t have a cost attached to it.
Labor costs at select-service hotels are also lower due to reduced levels of staffing versus their full-service counterparts, usually around 7 percentage points lower as a percentage of total revenue.
Full-service hotels, meanwhile, pull in a higher percentage of revenue from areas beyond rooms, and it’s for that reason that they require more revenue vigilance and more attention paid to performance metrics that fully encompass the breadth of their services.
“We must know the whole play in order to properly act our parts; the conception of totality must never be lost in that of the individual.”— Kakuzō Okakura, “The Book of Tea”
TRevPAR=total revenue/total available rooms
RevPAR=total room revenue/total available rooms
The following charts reveal departmental revenue as a percentage of total revenue in the U.S. and Europe, isolated by years 2015 and 2018.
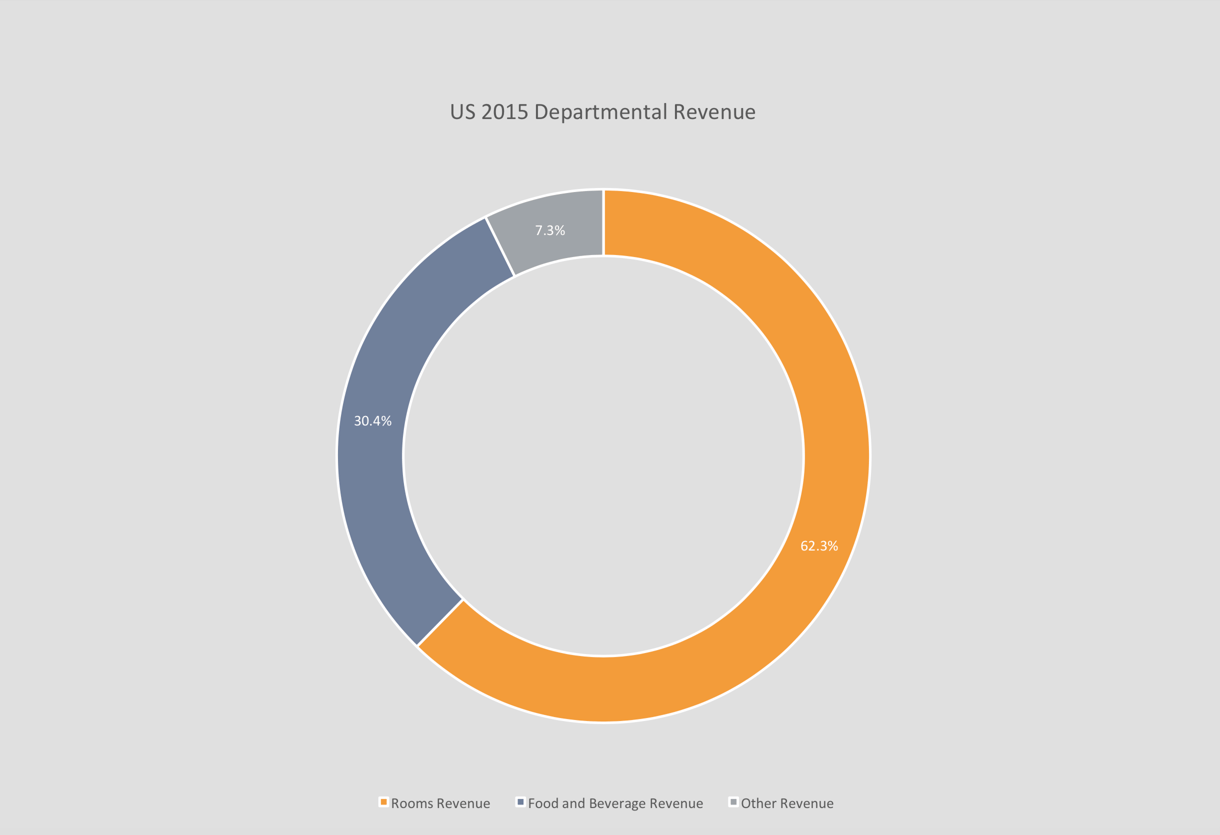
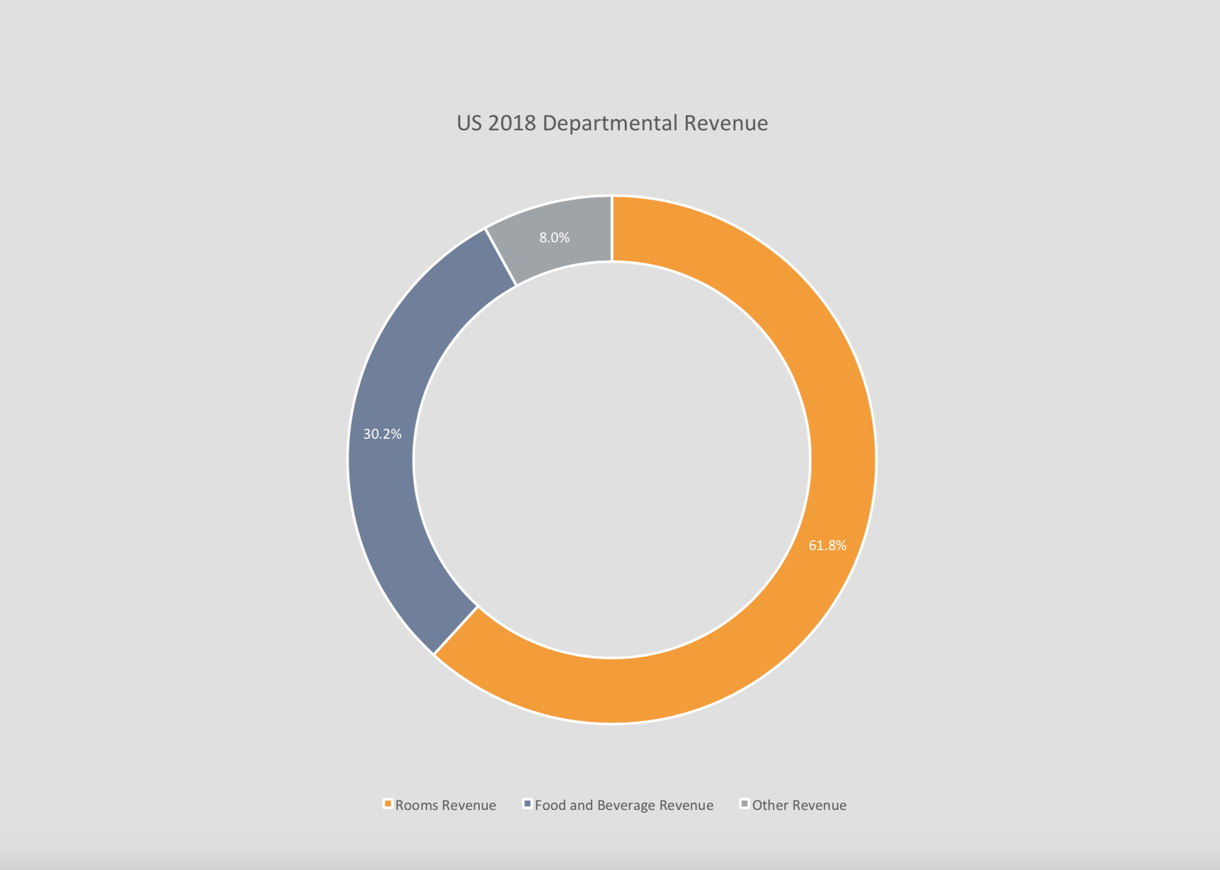
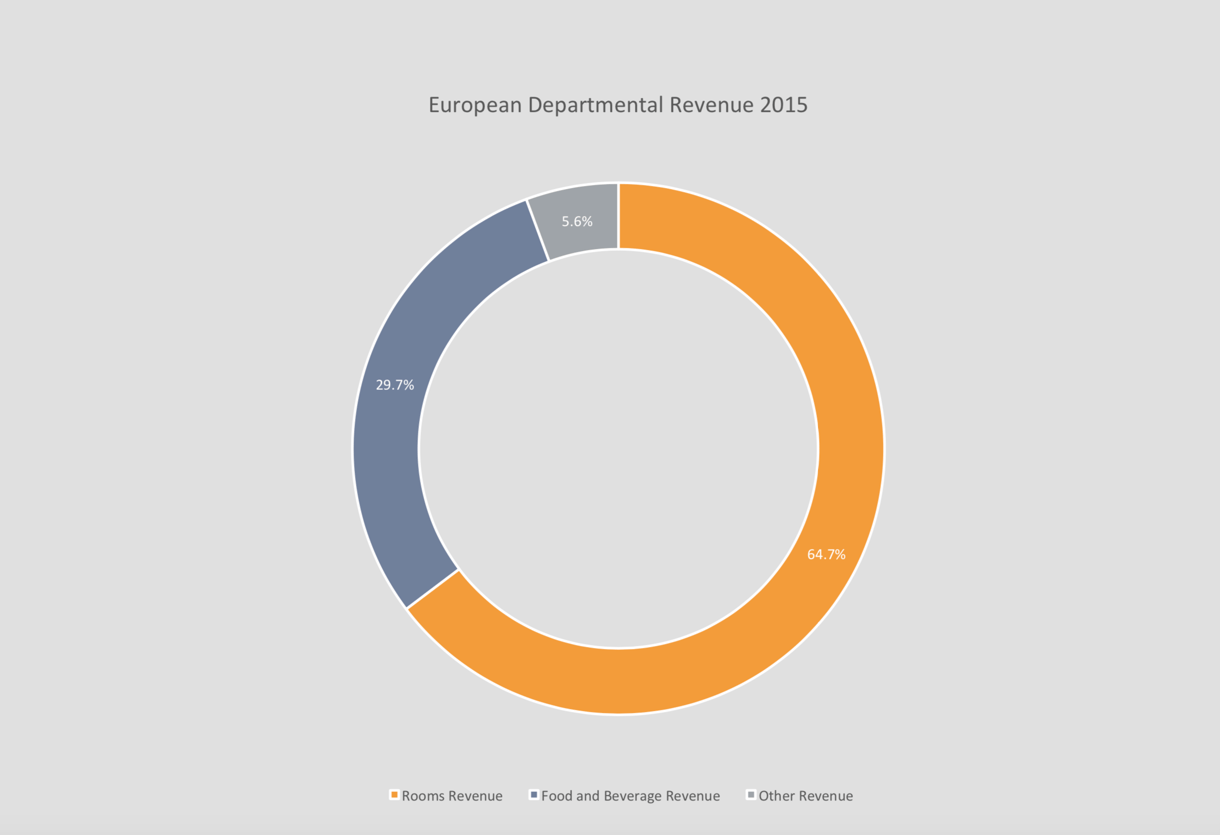
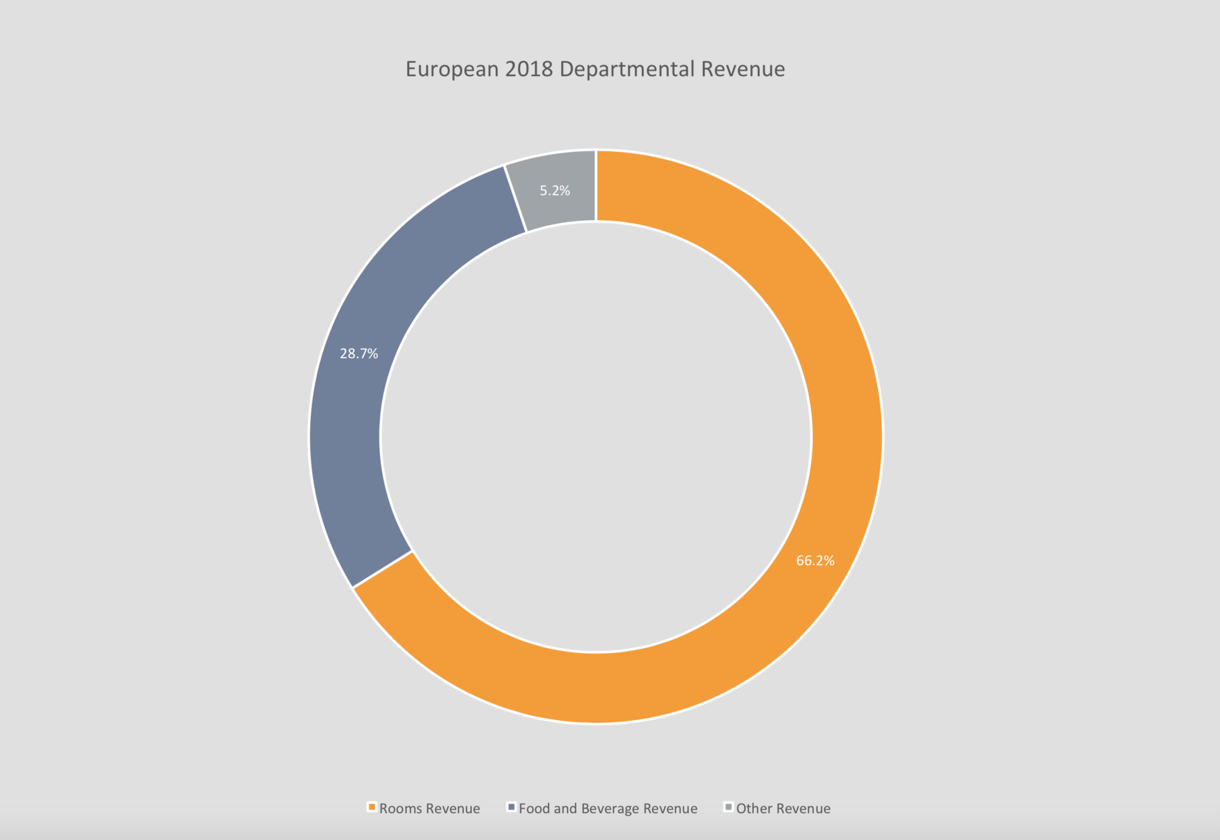
As the charts show, both rooms and F&B in the U.S. decreased slightly as a percentage of total revenue when comparing that of 2018 to that of 2015, but other revenue ticked up 0.8 percentage points. Meanwhile, in Europe, when comparing the same years, the room department grew while F&B and other sources of revenue receded some.
Meanwhile, there has been steady growth in revenue on a per-available-room basis across all revenue-generating departments.
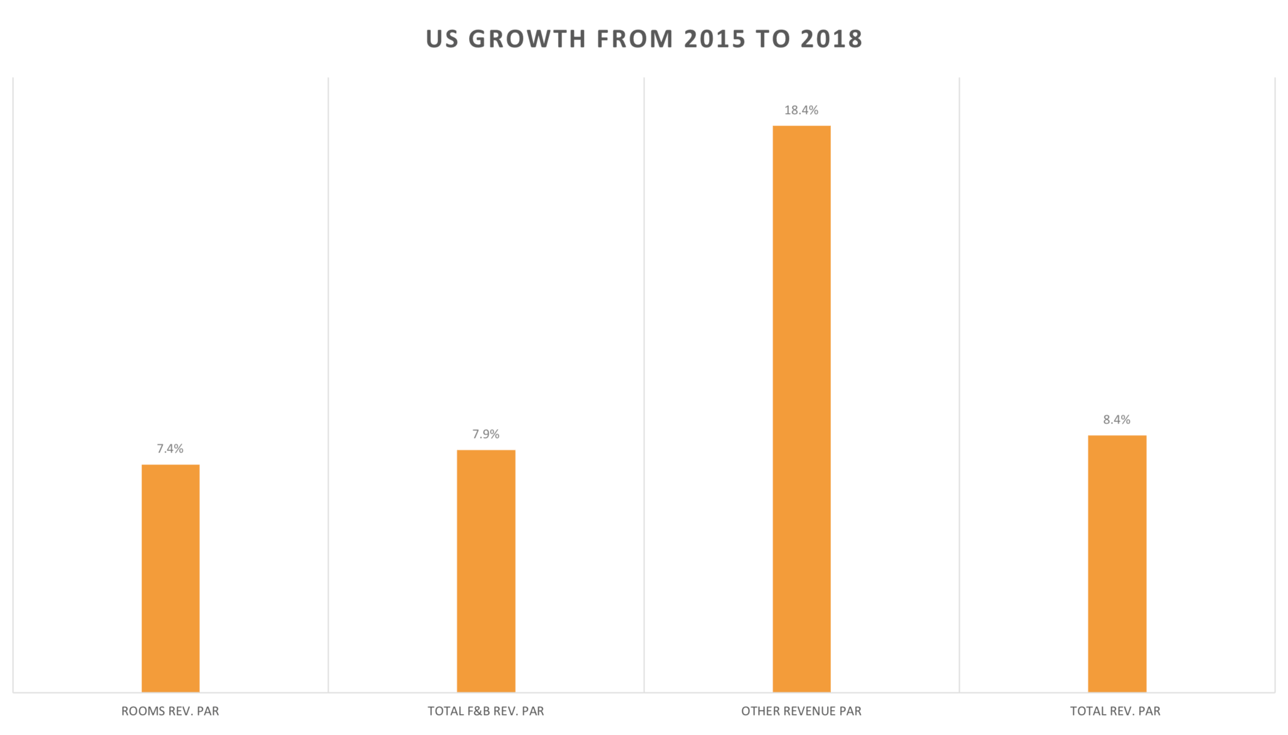
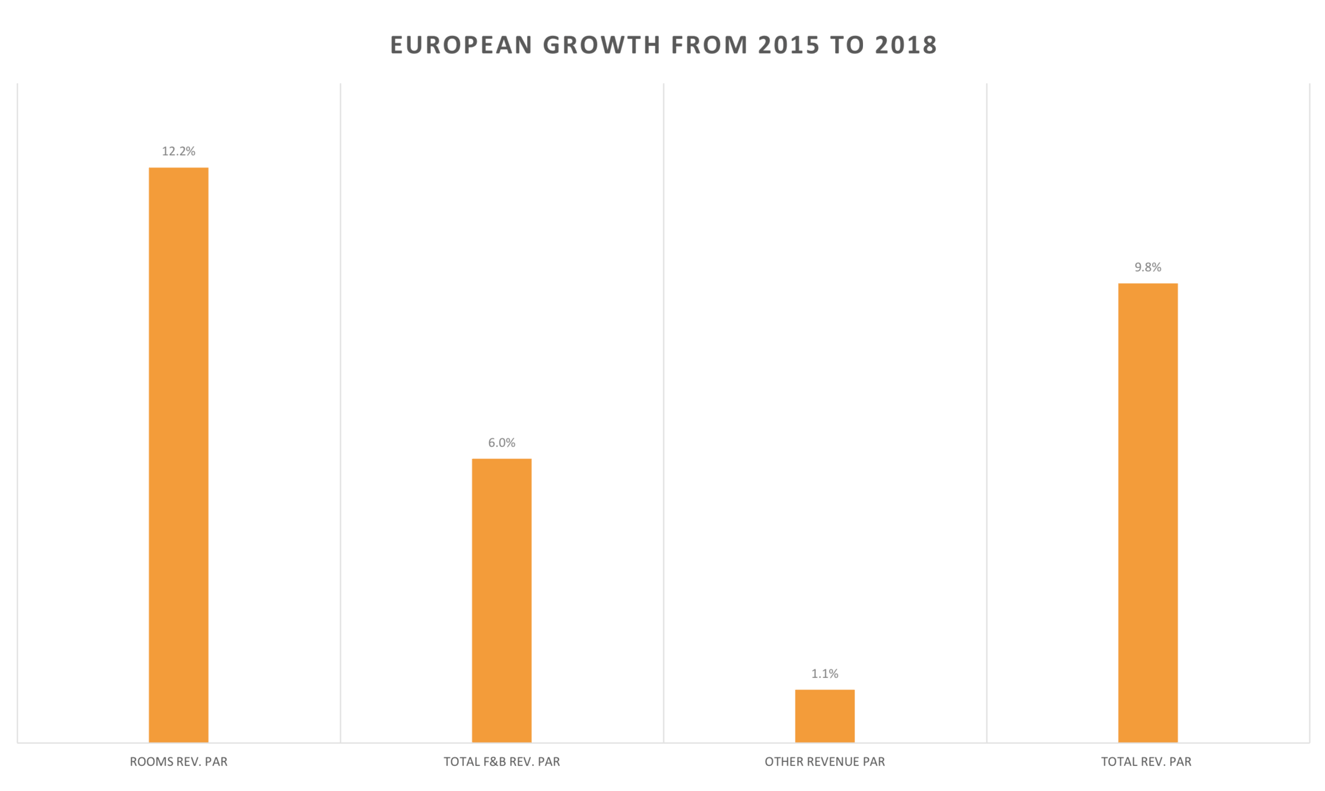
In the U.S., the largest growth from 2015 to 2018 was in other revenue, jumping 18.4 percent, while the largest growth in Europe has come from the rooms side, with RevPAR moving up 12.2 percent YOY for the period.
There are limitations to TRevPAR as a performance metric. It does not take into account any costs incurred by the hotel, and it also does not factor in the actual level of occupancy.
As the hotel industry—and by extension hotel properties on a market-by-market basis—becomes more varied and exotic in its offerings to both leisure-seeking and corporate guests, the stakes have grown in capturing revenue from an assortment of outlets. While putting heads in beds used to be the exclusive battle cry of the hotel industry, today, heads in beds still matter most, but waking hours carry more weight than they have in prior times. And it’s because of that that it is incumbent on hotel operators to maximize revenues across the breadth of their properties to ensure greater profitability.