By David Lund
With major wage increases in many jurisdictions, it is more important than ever to have a system for planning and measuring labor productivity in your hotel. This article explains how you can do this and it is not just for the big boys, you can utilize this system in any size operation.
I am working with a client who is just in the throes of getting this going in one of his hotels. It is a bit of work but well worth the effort as the results are going to pay off big time. I want to share what is working for him because I know it will work for you as well.
The first thing to create is a baseline for current productivity in your hotel. If you have a food and beverage operation in addition to your rooms, you should create two baselines: one for your rooms operation and the other for F&B. The productivity measures to establish are hours per room occupied in the rooms department, and hours per cover served in the food and beverage department.
For your system to produce the numbers you need, you must split the payroll hours into three main groups (or buckets): rooms, F&B and other. Once you have the three main groups, split the first two groups again, so you will end up with five groups. The American Hotel Associations 11th revised edition of the Uniform System of Accounts for the Lodging Industry (USALI) revenue and expense dictionary lays out all the positions that fall into all the various departments of any hotel. For this exercise you will use only three. You need to use three so you can get the two to measure separated from the third. Here are the three:
- Positions in the “Rooms Department” include all persons with guest-facing rolls: reservations, guest arrival, reception (day and night), concierge, all housekeeping positions, public spaces cleaners and, if you have a laundry, include it as well. Add all positions, both salaried and hourly, union or non-union. For this exercise now split the rooms section into two separate buckets: housekeeping and front desk.
- Positions in the “F&B Department” include all persons who contribute directly to the service and operation of your restaurants: beverage operations, banquets, kitchens, meeting spaces, cleaners and stewards. Include servers, bussers, hosts, runners, cooks and dishwashers. Include all positions, both salaried and hourly, union or non-union. Now split the F&B bucket into its two parts: kitchen and service.
- “Other” will include all general administration, sales, maintenance, retail, spa, golf, grounds or any other position that does not directly support these departments.
Do not fuss too much about positions that seem to not belong in either bucket. Make a decision as to where you will record it and just be consistent. The key here is to create the analysis and the productivity system, not to be perfect.
Once you have the positions organized into the five different buckets, group all record-keeping efforts in the same manner. All schedules, time sheets, payroll classifications, department numbers, etc. They need to be set up, so you can subtotal all the payroll activity within the five separate groups—both hours and dollars.
Now that you have the payroll organized by group you can start your analysis. The first section is the rooms, housekeeping and front desk. Pull your time sheets or run reports from your time clock or payroll system. What you are looking for are the total hours worked in these two rooms categories by all colleagues for the past full calendar year. Yes, that’s right: one full year. You are only interested in productive hours, not vacations, holidays or sick pay. When you have the total hours worked in each category divide it by the rooms occupied. Here is where you see the first light of day.
In a 75-room hotel that runs an annual occupancy of 75 percent you are servicing over 20,500 rooms.
Rooms
Days
Available
Occ %
Rms Occ
75
365
27375
75.00%
20531
Determine the total productive hours for each category, housekeeping and front office and divide the hours by the rooms occupied to establish the base line productivity for a full year. Overtime hours are just another hour, do not add a multiple for over time, it is 1-1.
Housekeeping
Front Desk
Hours
18304
6925
Rms Occ
20531
20531
Productivity
0.892
0.337 hrs per rm occ
Now you have your baseline of .89153 for housekeeping and .337 for the front desk. What you want to do now is use this baseline to target your productivity, information that will be used for improvements. From this point forward, use the same buckets for weekly schedules and on these, add the forecasted rooms occupied daily. Also total the hours worked and divide that by the rooms occupied, producing a daily productivity and a total productivity for the week. Tracking and managing productivity is like a baseball game, with innings. You are going to win some innings and lose some but what you really care about is the final score. Productivity is the same concept. You will have good productive days and poor days, mostly dependent on volume.
Always remember the most important things about managing labor:
- Your managers have little control over wage rates. Someone else sets most of these.
- Your managers have little control over business levels. Sure, you do right things through your advertising and promotion efforts. But the business that walks through the door, good or bad, needs to be serviced.
- What your managers do control is the schedule. This is where you want them to put their focus.

Looking at this schedule you can see the productivity scheduled for the week is below the annual standard of .892. The housekeeper must find some hours in their schedule. Looking at the least productive days of the week, he reduces the schedule by a total of 30 hours over three days.
The final and most important step is to update the schedule spreadsheet each day with the actual results for both rooms occupied, and the real hours worked.
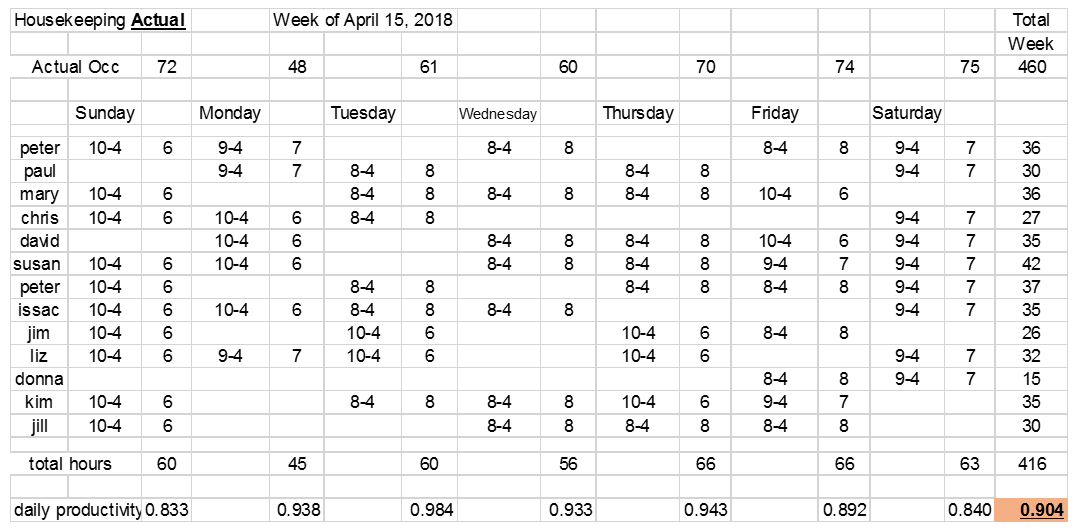
In the scenario above, the hotel managed to almost meet the annual productivity target. By having a productivity target and something to measure by, they managed to save 26 hours from the original schedule. Do this every week and I’ll let you do the math on that. Big savings and this is only the beginning.
Incentives Now that you have your baseline and your housekeeper is tracking and making improvements, it is time to introduce an incentive. Knowing that last year the baseline was .892, you will want to improve this in 2018. That means a lower number. Say target a 5 percent improvement with a threshold improvement of 3.5 percent and an exceptional target of 8 percent. If housekeeping productivity increases by 5 percent that means a thousand hours less payroll at 75 percent occupancy. Depending on your wage rate and benefits, this could easily be $25,000 in savings. Structure the incentive so it equates to a targeted $3,000 bonus, hit the threshold and it is $1,500, hit the exceptional target and it is $4,500.
By using a productivity improvement target, you are looking at potential savings if the goal is met and it can bet met regardless of occupancy. Let’s say the year is a tough one and occupancy dips to 70 percent. You still focus on productivity because it can be achieved at any occupancy level. When you are achieving a higher productivity level, having incentives is smart when business is good or bad.
Innovation That is a natural by-product of focusing on increasing productivity. Getting your team focused on what brings better work processes to the table is powerful. Your leaders and staff all have ideas and when you set the stage to welcome those initiatives people will appreciate you for taking their ideas and making them a reality. Many hands make light work, my mother would always say. Being more productive is not about working harder, it is about working smarter. If you can study the processes and materials, you will find ways.
Efficiency is doing better what is already being done. ~ Peter Drucker
Back to the other buckets Once you have your payroll positions organized and the baseline established, do the same processes with the schedules and the daily tracking for the front office, food and beverage service and kitchen operations. In the food and beverage space it is covers you want to measure against the hours worked. A cover by the new definition is anyone who you serve who orders any food or beverage item. A table of four who all have a meal and drinks is four covers. A table of four that orders chicken wings to share and a round of drinks is four covers. A table of four that orders a round of drinks is four covers. Training your staff to record proper cover counts in your point-of-sale system is key.
Having a manager in place that sees the value in better productivity is essential and part of the culture you want to promote and reward.