September 16, 2015
The U.S. Department of Commerce announced that the United States welcomed 16 million international visitors¹ during the first quarter of 2015-183,000 more than in the first quarter of 2014 – a one percent increase in visitors.
March 2015 marked the 15th consecutive month of growth in total U.S. visits since January 2014. 5.9 million International visitors traveled to the United States in March, an increase of 0.2 percent compared to March 2014.
HIGHLIGHTS ²
Top Inbound International Markets
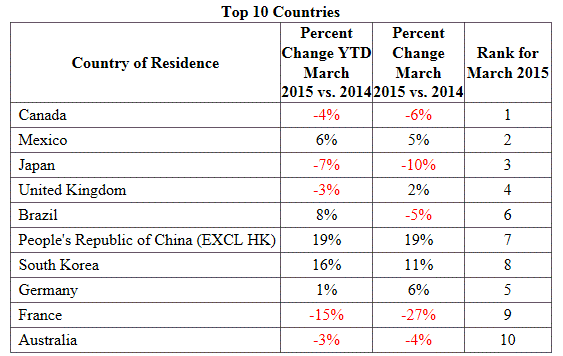
- The top inbound markets continued to be Canada and Mexico. Overnight volume from Canada totaled 5 million visitors during the first quarter of 2015, a four percent decline compared to the first three months of 2014. At the same time, Mexico recorded 4 million visits to the United States, an increase of six percent. The Japan (-7%), the United Kingdom (-3.4%) and Brazil (+8%) rounded out the top five inbound markets.
- During the first quarter of 2015 half of the top 10 countries posted increases in non-resident visits. Non-resident visitation from two of the top 10 countries registered double-digit increases.
- In March 2015 six of the top 10 countries posted increases in visitation to the United States.
 Regional Markets
- Six of the nine³ major overseas regional markets recorded an increase in non-resident visits to the United States during the first quarter of 2015: Asia (+6%), South America (+5%), Middle East (+15%), the Caribbean (+16%), Central America (+12%) and Africa (+11%)
- Western Europe (-4%), Oceania (-2%) and Eastern Europe (-14%) recorded decreases for the first quarter of 2015.
Non-Resident Visits from Overseas Countries
- Travel from overseas markets accounted for 44 percent of total arrivals to the United States during the first three months of 2015.
- YTD March 2015 non-resident visits from overseas countries (7.1 million) were up three percent over the same period 2014.
- March 2015 overseas resident visits (2.5 million) were up three percent compared to March 2014.
Top Ports: YTD March 2015
- YTD March 2015 visitation through the top 15 ports of entry accounted for 86 percent of all overseas visits-a percentage point less than last year.
- The top three ports (Miami, New York (JFK) and Los Angeles) accounted for 42 percent of all overseas arrivals-about the same as last year.
- Eleven of the top 15 ports recorded increases in arrivals in the first three months of 2015. Six of these ports recorded double-digit increases.
Pleasure Travel vs. Business Travel
- During the first quarter of 2015 of the top 20 overseas countries with visits to the United States, more than 90 percent of the visits recorded from Brazil (91%), Argentina (93%) and Ecuador (91%) represented pleasure travel to the United States. On the contrary, 25 percent or more of the visits recorded from Germany (26%), Italy (25%), India (29%) and the Netherlands (33%) represented business travel to the United States.
- During the first three months of 2015 for all overseas non-resident visits to the United States, 77.3 percent represented pleasure travel and 16.2 percent represented business travel.
Access to NTTO Data
The National Travel and Tourism Office (NTTO) collect, analyze and disseminate international travel and tourism statistics from the U.S. Travel and Tourism Statistical System. NTTO produces visitation data tables, including a more detailed region, country and port analyses. To access these data, you are encouraged to visit the NTTO monthly arrivals page at http://travel.trade.gov/view/m-2015-I-001/index.html.
___________________________________________________________________________________________
¹ This report integrates the volume of inbound International visitors to the United States from residents of other countries using three U.S. and International government sources: the U.S. Department of Homeland Security/U.S. Customs and Border Protection I-94 arrivals program data, Statistics Canada’s International Travel Survey and Banco de Mexico travel data.
² Throughout this report percent changes posted for International visits to the United States for percent changes posted for year to date 2015 were calculated by comparing data for January – March 2015 to data for January – March 2014. Also, percent changes for March 2015 were calculated by comparing data in March 2015 to data in March 2014.
³ The nine major overseas regions are Western Europe, Eastern Europe, Asia, the Middle East, Africa, Oceania, South America, Central America and the Caribbean.