January 2022 Top-Line Metrics (percentage change from January 2019):
- Occupancy: 47.8% (-12.6%)
- Average daily rate (ADR): US$123.51 (-0.3%)
- Revenue per available room (RevPAR): US$58.98 (-12.8%)
Key Points from the Month
- The weekday occupancy index (to 2019) softened significantly more than weekends.
- Group demand remained flat month over month, however, the group demand index fell significantly.
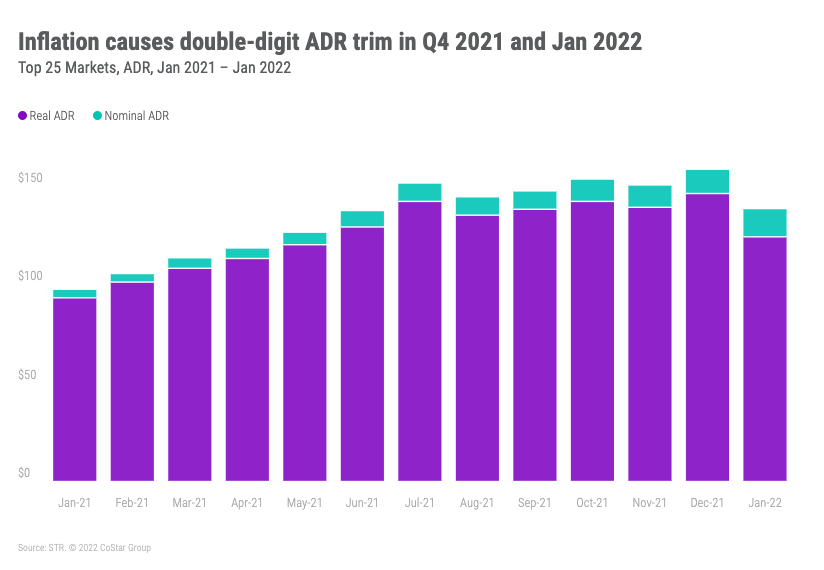
- While demand (and occupancy) softened moderately across virtually every segment of the industry, ADR indexes fell only modestly month over month even in the Top 25 Markets, as higher-than-anticipated January inflation drove hoteliers’ costs even higher.
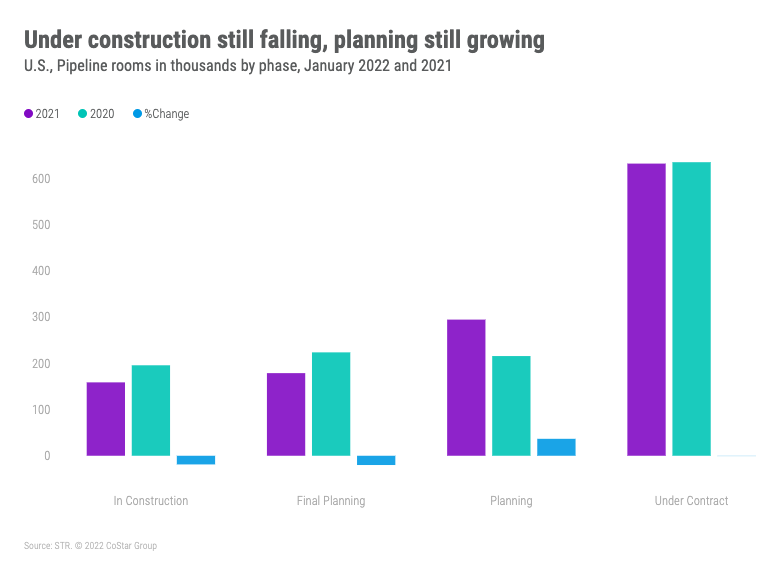
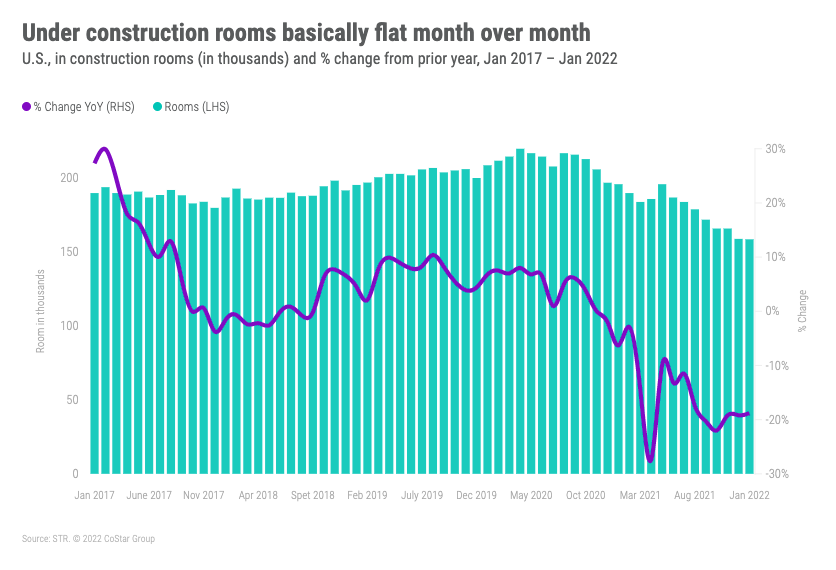
- The number of rooms in construction continued to decrease year over year, although the rate of decline slowed as the industry entered a second year of construction constraints.
- The dip seen in January will be short-lived, which is already supported in the first few weeks of data from February. Softer winter performance without any new variants or COVID surges was expected—a reversion to historical winter, shoulder-season normalcy.
Top 25 Markets
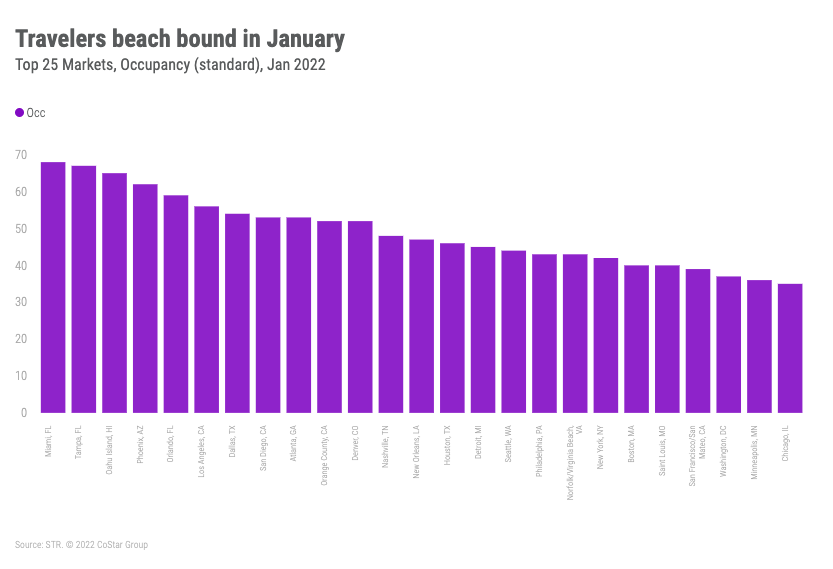
Among the Top 25 Markets, Miami experienced the highest occupancy level (68.2%), which was still down 12.9% from the market’s 2019 benchmark.
Markets with the lowest occupancy for the month included Chicago (35.4%) and Minneapolis (36.1%).
San Francisco/San Mateo reported the steepest decline in occupancy when compared with 2019 (-46.3%).
Overall, the Top 25 Markets showed higher occupancy and ADR than all other markets.
Beach markets and warmer southern markets led absolute occupancy in the Top 25. Business-reliant markets (DC, Minneapolis), cold markets (Chicago, Boston), and COVID-restricted markets (NYC, San Francisco) reported lower occupancy. A lack of inbound international travelers into key cities continues to be a headwind.
However, even the lure of (temporarily) escaping the cold wasn’t enough to offset all-important business travel, and Top 25 Market indexes took a significant dip in January.
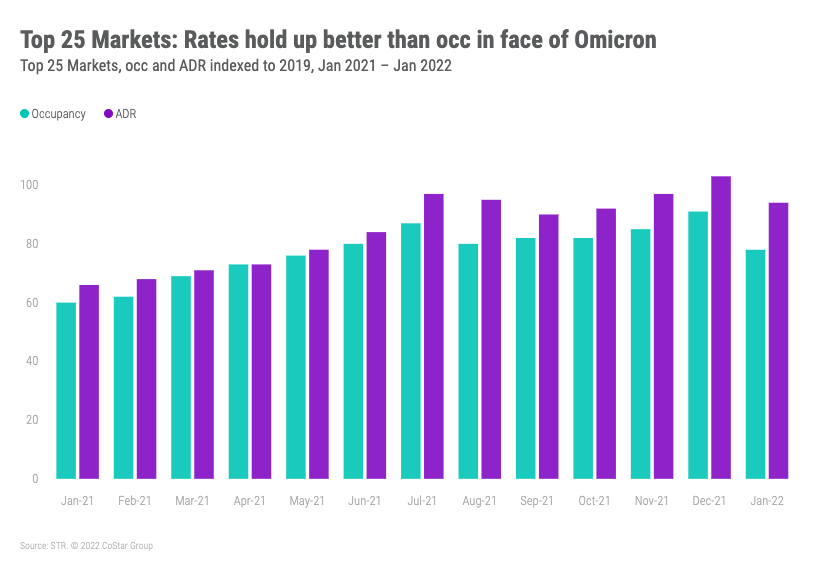
ADR held up better than occupancy, losing nine points (9.0) from December’s pandemic-era high index of 103.0%.
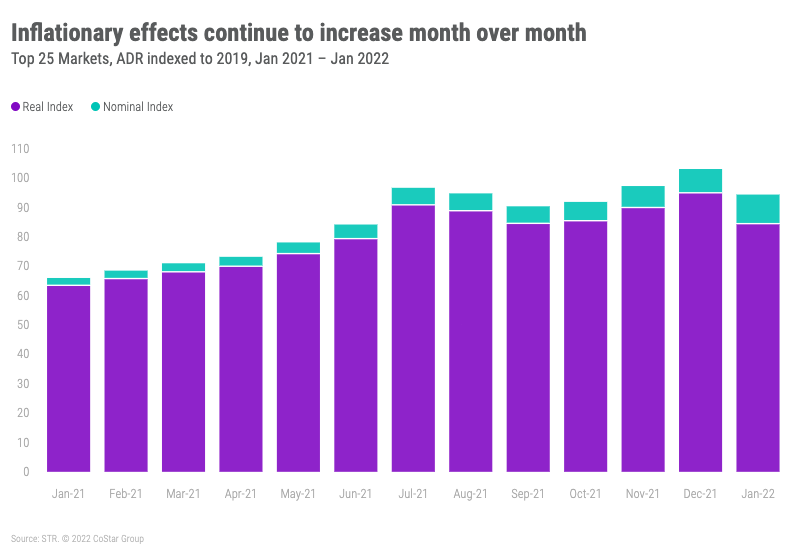
The dark blue piece of the bar represents the ADR that’s being consumed by rising prices. Some of the biggest and most volatile contributors to inflation—gas, energy, and food prices—are major items for a hotel’s P&L
If you want to translate to dollar terms, inflation skimmed $14 off the top of Top 25 Market ADR in January.
Pipeline
As the second year of an in-construction slowdowns begin, the total number of rooms in construction continues to fall month over month, but the percent change has started to level out.
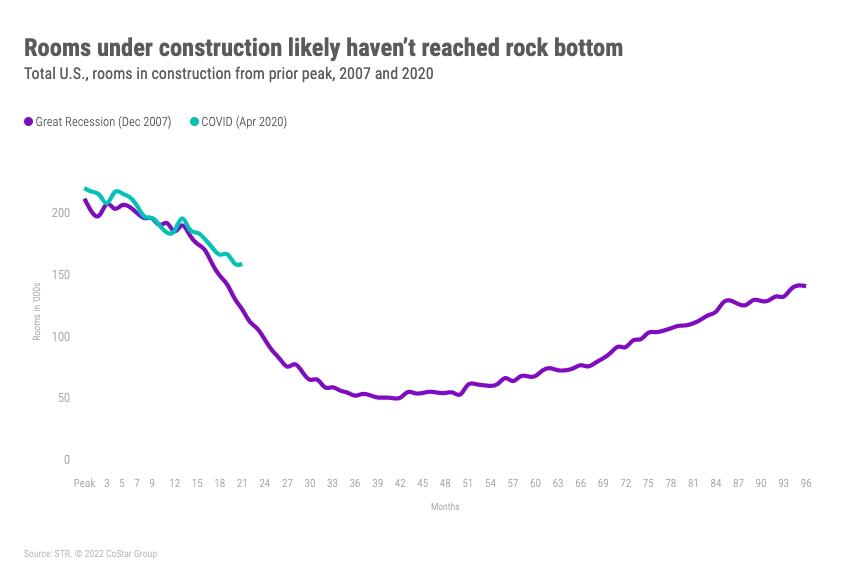
The slope of the COVID-induced construction downturn is starting to look a little bit flatter than the 2008 trend.
The number of rooms in the planning phase continues to increase year over year, while final planning is falling, pointing to a long-term return to development. There is not much movement in the short- and medium-term.