WASHINGTON (May 8, 2018)—Travel to and within the United States was up 3.4 percent year-over-year in March, according to the U.S. Travel Association's latest Travel Trends Index (TTI)—marking the industry's 99th straight month of overall expansion.
The March TTI generated some eye-catching numbers, mainly due to the earlier timing of Easter (April 1). Higher volumes of international travelers tend to visit the U.S. close to that holiday, while domestic business travel typically falls, according to U.S. Travel researchers.
Accordingly, international inbound travel to the U.S. registered eye-popping 11 percent year-over-year growth in March. Domestic travel, meanwhile, posted modest growth of 2.6 percent, and was largely dragged down by weak domestic business travel (up a meager 0.2 percent).
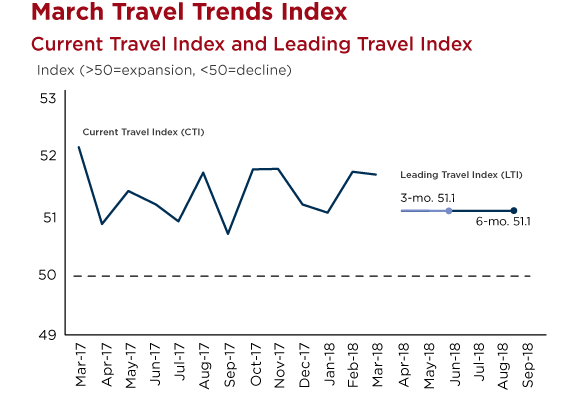
Still, the TTI forecasts a healthy trajectory for travel overall through 2018. The Leading Travel Index (LTI)—the predictive component of TTI— projects an overall growth rate of 2.2 percent through September, with the international sector growing three percent in that period.
But despite the positive outlook for international travel, U.S. Travel economists note that the U.S. is likely squandering a massive economic opportunity by failing to keep pace with the international travel boom. The U.S. share of the global international market slid from a peak of 13.6 percent in 2015 to 11.9 percent last year.
"On the bright side, we are not experiencing the decline in international inbound travel that many feared," said U.S. Travel Senior Vice President for Research David Huether. "However, the U.S. is not keeping pace with the global travel boom. As a result, we are continuing to lose market share to competitors."

The TTI is prepared for U.S. Travel by the research firm Oxford Economics. The TTI is based on public and private sector source data which are subject to revision by the source agency. The TTI draws from: advance search and bookings data from ADARA and nSight; Airline bookings data from the Airlines Reporting Corporation (ARC); IATA, OAG and other tabulations of international inbound travel to the U.S.; and hotel room demand data from STR.
Click here to read the full report.