
Performance benchmarking is paramount in the hospitality industry, and whether measuring success against yourself, the competition or a specific segment of the market, the process involves foundational historical metrics.
This article is part of a series on hotel benchmarking data sets. Reach the other editions here: The role of profitability data in a comprehensive hotel benchmarking experience | Using business on the books in a complete benchmarking approach
Who uses hotel historical data? How does it support strategies?
Benchmarking is the foundation of any decision making. If you don’t know where you have been, you don’t know where you are presently and you don’t know where you are heading. Historical data centers you to what is working and where opportunities exist. The utilization of historic data tells any revenue, sales, or marketing strategy where it should be focused and whether a strategy is delivering improved market share over time. Additionally, historic data supports performance management, financial management and stakeholder management decisions and outcomes. In short, there aren’t many industry disciplines that don’t apply historical metrics to their daily functions. For example:
- General managers use day-of-week splits to gain a holistic view of the market, understand the evolution of market demand, and spot opportunities to drive performance. Also, percentage change in a RevPAR index is used to set bonus targets for department heads.
- General managers and individual owners work with their revenue manager to set a strategy for segmentation and rate mix.
- Revenue managers inform their pricing approach based on historical occupancy and competitive market trends. Revenue managers align their forecasts and budgets to market share growth as part of short- and long-term projections. This enables not only a flexible forecasting approach, but a more direct measure of outperformance capability.
- Ownership representatives assess the competitiveness of their portfolio through multiple performance indices.
- Finance departments track daily/weekly/monthly changes in performance across all KPIs and their relative impact to profitability.
- Portfolio representatives evaluate property success, combine historical metrics with forward-looking to approve property pricing strategies, set property budget targets, and measure portfolio competitiveness.
- Marketing teams build and adjust promotional campaigns based on demand patterns.
3 key hotel performance indicators (KPIs)
Hotel benchmarking often involves three key top-line performance metrics: occupancy, average daily rate (ADR) and revenue per available room (RevPAR).
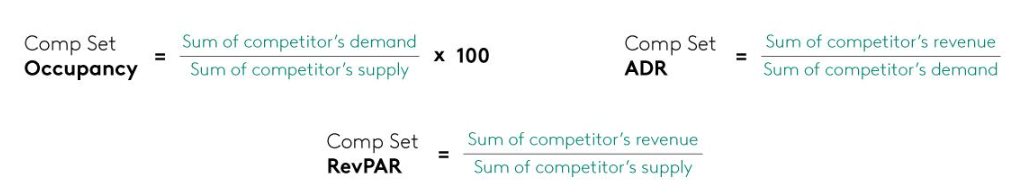
To better understand the percentage of available rooms sold over a specified period, hoteliers measure their property’s occupancy against their market/competitive set, and in normal times, look at movement through year-over-year changes or comparison against other periods. The formula used to calculate occupancy:

Like any sellable product, rates are applied to sold rooms/inventory, and the actualized amount paid for a room is known as ADR (Average Daily Rate). This KPI is calculated per the formula below:

Revenue per available room describes the total revenue achieved per room whether sold or not. The metric reflects the balance between occupancy and ADR with each metric capable of driving movement. RevPAR is the industry’s central metric, widely used in the revenue-management discipline because it allows hotels and portfolios to measure performance success across the marketplace, regardless of hotel type or location. RevPAR provides a convenient and comprehensive snapshot of the big picture—are you bringing in the right number of guests and are you pricing effectively? RevPAR is the most effective top-line metric when it comes to measuring market share and is an accurate indicator of profitability, with percentage changes in gross operating profit per available room (GOPPAR) generally 1.5 to 2.0 times more than RevPAR.

How the 3 KPIs fit in your hotel benchmarking strategy
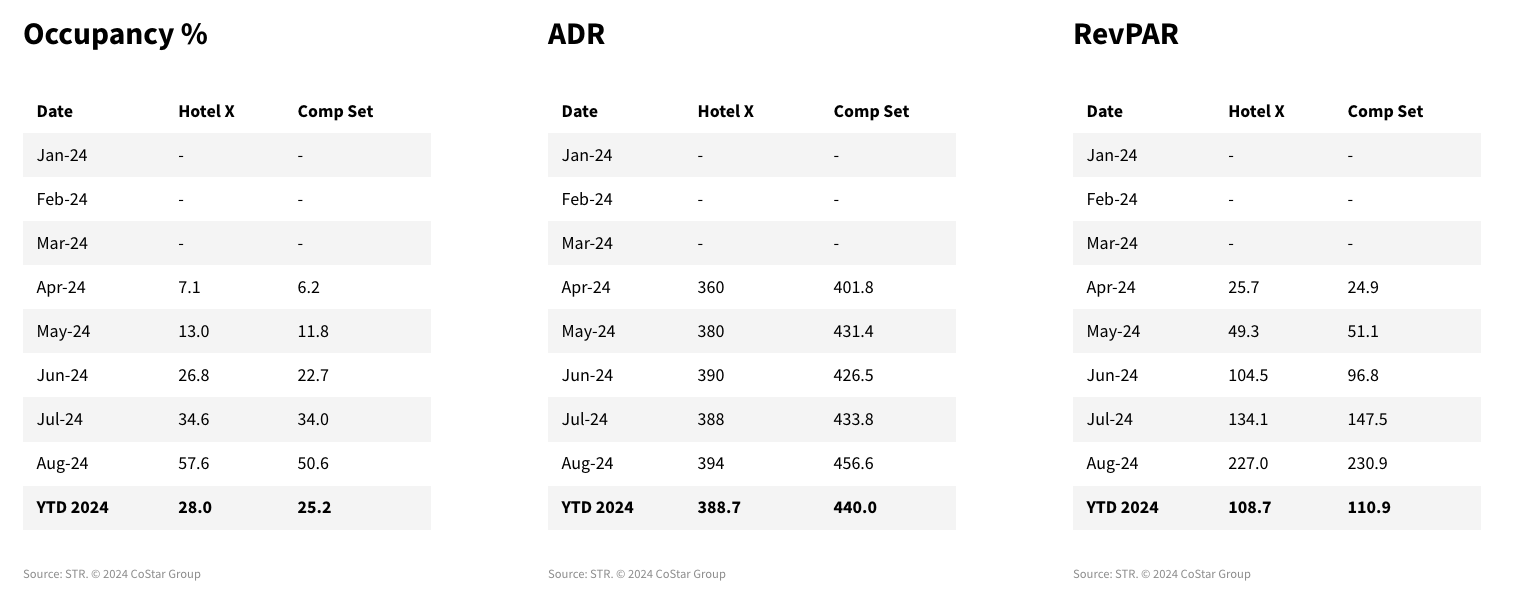
The below example compares Hotel X against its competitive set. A competitive set, which is a critical element of benchmarking (first introduced by the STAR Report), is a group of similar hotels that compete with your property for business.
Please note that competitive set performances are calculated based on the aggregated raw data (supply, demand and revenue) of said set.
- In terms of occupancy, Hotel X reported 57.6% occupancy in August, which is ahead of the competitive set.
- To dig further into how Hotel X has performed within its comp set, we would refer to its occupancy ranking index and respective % change to a period.
Solely looking at your occupancy, you may explain gaps on a daily and monthly basis, your competitive set’s market share compared with your own, and your property’s ability to capture demand. Occupancy isn’t the only goal, however, as cost incurred to hoteliers need to be paid, and ultimately, margins need to be increased. How the competition performs and how you place your property within the marketplace will define the price at which rooms are sold.
- In this example, Hotel X’s ADR is lower than the aggregated competitive set ($394 for August)
- Is Hotel X’s higher occupancy because of its lower prices? Does Hotel X keep this strategy in place? Will that strategy drive profit in the long-term?
As explained above, revenue managers need to capture the overall picture, which is why RevPAR is considered the guiding KPI, being a product of both occupancy and ADR.
- Hotel X recorded RevPAR of $227, while its competitive set hit $230.90 in August.
- The stronger ADR performance of the rest of the competitive set has pulled its RevPAR performance upward despite a lower occupancy.
- To increase its RevPAR relative to the comp set, Hotel X may have to rethink its strategy. Instead of pushing for higher occupancy, there could be more focus on ADR. In that scenario, there could be lower occupancy, but overall performance measured in RevPAR would be higher.
Key questions and answers
The past, present and future elements of a comprehensive benchmarking strategy work together to complete the strategic picture. Before looking ahead, hoteliers set a foundation for their approach with answers to key questions based on the recent days, weeks, months and years.
- Are you ahead of the competition or can you make gains in occupancy and average daily rate?
- Which days of week, months or seasons provide opportunity for further growth?
- How are you tracking to your performance targets relative to market conditions?
- What are the growth rates of your direct competition?
- How is performance varying between your competitors and the market?
- What is your competitor strategy? Growth through occupancy or room rates?
- What are the underlying factors behind changes in demand and rate? A shift in transient or group demand sources?
- Is there high enough group demand in your market to facilitate a shift in your marketing strategy?
- Did your competition pick up a significant number of contracted nights?
- What impact is new supply having to the market and competitor set?
- Are you gaining or losing market share and where might that be happening?
- What is the impact of historical performance on profitability share and forward performance trends relative to your competitors?
Data quality matters
Different sources of data can produce varying levels of quality, accuracy and actionability. That is why we generate historical metrics from raw data sourced directly from hotels. Our industry relationships, built on almost four decades of benchmarking experience, position us to work with more hotels than any other data provider around the world. With data from 80,000 properties in 180 countries, we curate the most relevant, available market data to enable you to compare against your hotel or portfolio.
We also achieve the highest standards of data confidentiality, security and service. Those standards are met through robust data validation, relationship databases and enhanced property isolation checks. For reference, please see our data guidelines.
Learn more about competitive benchmarking.