
U.S. hotel occupancy leaders and laggards in the March 2023 “bubble” chart update reinforce three key trends that began to develop late in 2022.
- The overall distribution of demand continues to shift away from the pandemic rural/outdoor focus back to larger urban destinations.
- Major markets continue to close the deficit to pre-pandemic levels.
- Leisure-oriented markets remain firmly rooted near the top of the national leaderboard. As we have already entered the school spring break season, we expect warmer markets near beaches to maintain their strong performance in the coming weeks.
While the four weeks ending 18 March were not yet peak travel season, it was a good sign that 18 of the nation’s largest markets posted four-week average occupancy at 65% or higher.
As further indication of gains in urban markets, average Sunday-Thursday occupancy grew to 62.0%, which was up from 59.3% for the corresponding period last year and fairly close to the 64.1% matched period from 2019. Overall demand has caught up and surpassed 2019 levels by 1%. Meanwhile, new development has added 3.6% more rooms since 2019, which raises the bar for markets to match their historical occupancy levels.
Another clear pattern among market-level leaders is the heavy influence of normal seasonal patterns. There are less-than-subtle signs that travelers at this time of year prefer their accommodations to be in warmer markets.
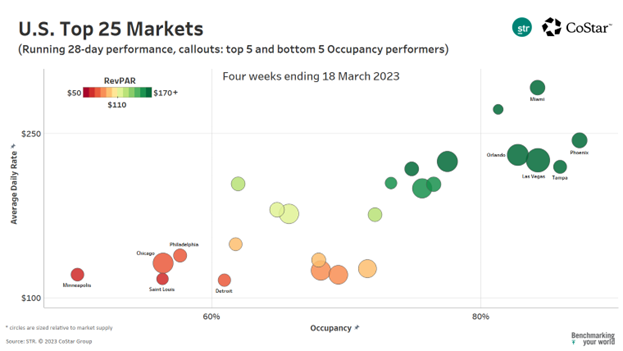
The Top 25 markets were led in occupancy by Phoenix (87.4%), which was up sharply from the same period last year (81.8%). Next was Tampa (85.9%, -1.0 ppts), Las Vegas (84.3, +8.5 ppts), Miami (84.2%, -2.0) and Orlando (82.8%, -1.0 ppts).
Among the Top 25’s low occupancy markets, only Detroit (61.0%) had roughly matched its occupancy from 2019. In a sign that select markets still have major ground to make up, Minneapolis’s 50.0% occupancy for the period had hardly budged (+2.0 ppts) from last year and remained well below the 2019 comp of 61.2%.
Las Vegas, the largest U.S. hotel market, reported the nation’s fastest annual growth in average daily rate (ADR), and subsequently, revenue per available room (RevPAR). ADR increased 37% to $225, and RevPAR jumped 53% to $190. In real RevPAR terms (inflation-adjusted), the market’s index to 2019 was 139 (or 39% above 2019).
All five Top 25 leaders bested their matched RevPAR from 2019 even after accounting for a 19% increase in inflation. Among lower occupancy markets, Minneapolis reported a RevPAR index of 75, with Chicago, St. Louis and Philadelphia all indexing at 85. Detroit’s RevPAR index (95) shows that “Motor City” is in a somewhat better position toward meeting its pre-pandemic performance.
Overall, only four of the Top 25 Markets either matched or surpassed their comparable four-week occupancies of 2019. However, all large U.S. markets with exception of St. Louis and the three in Florida posted year-over-occupancy gains.
Among the 167 STR-defined U.S. markets, almost two-thirds grew occupancy from the matched period of last year. A major portion of those markets which did not gain occupancy YoY were 2022 standouts that likely peaked last year.
The Top 25 Markets also dominated the national ADR growth charts, taking five of the 10 fastest annual growth positions for ADR and six of the best 10 gains in RevPAR growth. Overall, 156 of 167 (93%) markets grew their matched four-week ADRs from last year. Among those that reported ADR growth, two-thirds (104 of 156) grew their ADR faster than 6%, the recent pace of annual inflation. Annual RevPAR growth occurred for 137 (82%) markets with 98 markets’ RevPAR meeting or beating inflation.
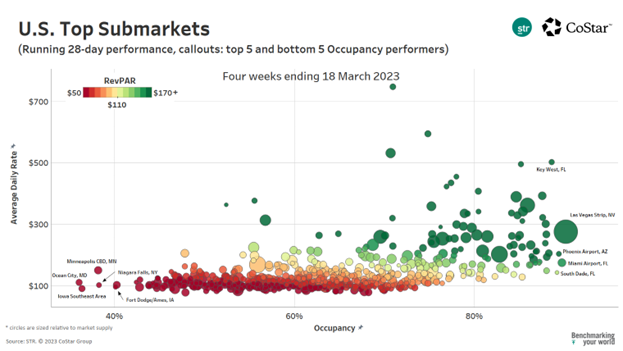
STR submarkets for the four-week period were led in occupancy by the Las Vegas Strip at 90.2%, which was up from 80.2% last year and 89.0% in 2019. On a real RevPAR basis, the submarket indexed at 141 or 41% higher than the matched 2019 comp. Next on the leaderboard was the Miami Airport submarket at 89.9% (103 index), the Phoenix Airport submarket at 89.4% (107 index), South Dade, FL at 89.2% (100 index) and Key West at 88.6% (101 index).
A submarket perspective to national performance provides a lot of information into national patterns, including the importance of climate patterns along with ongoing popularity of leisure-based markets. With Las Vegas as a special aside, the 30 best occupancy submarkets for the period were located either in the Phoenix market or somewhere in the state of Florida. Beaches, along with warm weather, dominate this time of year, particularly as we move into the school spring break season.
The submarket bubble chart shows that many submarkets have relatively high ADRs despite running less than full occupancies. By-and-large, those submarkets include mostly luxury-oriented destinations, such as Hawaii or ski resorts. The pandemic emergent strategy among high-end hotel markets that charged premium rates (perhaps at some loss of room demand) remained in effect through the late winter season.
For more information, be sure to check out our weekly updates in STR’s Market Recovery Monitor.
If you are interested in accessing the data behind this visual via our hospitality platform in CoStar, please contact us at If you are interested in accessing the data behind this visual via our hospitality platform in CoStar, please contact us at info@str.com.