| By: Theodore Noseworthy - HVS International
- Toronto
When it comes to branding, many people only think of promotional efforts and advertising mediums. The true measures required to adequately account for a brand are rarely comprehended; this is due in part to ambiguity in how branding is defined. A brand is not only a unique product - it is a title of distinction for businesses and consumers alike. Contemporary literature on the matter, allocates a brand as an asset, which increasingly exceeds its conventional value. 1 The cost associated with efforts to conceptualize and implement a new brand has been approximated at $100-million, and there is a 50% probability of failure.2 With such an apparent risk, many question the inherent value that a flag may contribute to operational performance. In light of this, there have been several attempts to financially quantify brand equity. Unfortunately, many of these attempts are met with resistance due to the inherent subjectivity in their application. The purpose of this article is to provide a comprehensive validation of the occurrence of brand equity; and attempt to frame that 50 percent 'success' rate as the proverbial cup that is "half full." Brand equity must first be sufficiently defined. Universal definitions typically define brand equity as "the added value endowed by the brand to the product," which encompasses both financial and consumer perspectives or considerations.3 When stripped to its foundation, brand equity is composed of customer loyalty, awareness, perceived quality, channel relationships, positioning, and proprietary resources (i.e., names or symbols).4 The key here is to recognize the humanistic elements: customers, perceptions. Brand equity, in the service context, is achieved through corporate ideals: it manifests in consumer perceptions and succeeds on an individual basis. However, the inherent subjectivity of consumer behaviour does not lend itself well to the discipline of financial valuations. In light of this complexity, it would seem rather intuitive to initially dispense with financial aspects and commence with components that adequately demonstrate the behavioural aspects of consumer patronage. To do so, this analysis looked specifically to penetration rates of both occupancy and yield. These rates were deemed crucial to the interrelated nature of financial performance and transient behaviour. In total, 51 Canadian competitive-sets were analyzed.
Once segregated, based on whether branded or not branded, the data was
correlated to assess the statistical variance and association in market
performance. The following table illustrates the cumulative results.
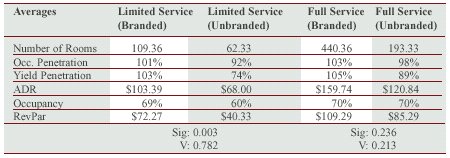 As illustrated within the confines of this analysis, from a statistical perspective, there is a significant operational difference between a branded and unbranded lodging facility at the limited service level.5 Upon further inspection, the level of association documented strong predictability between penetration levels and whether or not a limited service facility currently employed a flag.6 It must be noted, however, the "competitive market," in this context, is indicative of the competitive composition of this assessment (i.e., an adequate distribution of branded versus unbranded properties). Markets dominated by management and franchise agreements may not demonstrate comparable results due to the inherent substitutability in product offerings. 7 With respect to full-service lodging, there seems to be apparent differences between branded and unbranded properties, but the discrepancies between the two are not necessarily statistically viable. The plausible reason being, there is more utility involved in a purchase at this level; full-service purchases are usually not made on impulse, nor are they necessarily indiscriminant purchases based on price. Within the confines of this analysis, the average branded lodging property employed higher rates while exceeding its fair share of the market; this translates into an increase in revenue per number of available rooms. This process can be observed in many competitive markets where branded and unbranded hotels of similar offerings, location, and quality demonstrate relative inconsistencies in rate and occupancy. What is interesting is the differential between occupancy and yield penetration. Although occupancy penetration illustrates moderate consistency between branded and unbranded facilities, yield penetration was substantially offset. When analyzed in accordance with discrepant ADR assessments, unbranded penetration analyses demonstrated a return to what is referred to as "Driving Occupancy." Strategically, augmenting one's occupancy can be utilized for initial rate adjustments; unfortunately, this approach is far too often utilized exclusively as an archaic evaluative piece, done so for market comparison, neglecting to account for measures of operational efficiency. From a real-estate perspective, these properties may retain similar point-in-time value, yet when acknowledging highest and best use, demonstrate considerable inconsistencies in future earning potential. This is not to say that there was no indication of what is referred to as "outliers." Some branded hotels significantly underperformed within their competitive sets, although this was more apparent in mid-scale accommodations. Upscale or "high profile" brands consistently generated comparable results across competitive fields. On the flip side, there were independent hotels that far exceeded their fair share of the market. However, when scrutinized closely, many of these properties were in fact inherently branded-if only in a peripheral manner. It is possible to be branded as having no brand at all or branded in accordance with proximity to demand, inherent exclusivity, or unusual offerings (typically with upscale properties). When occupancy and yield penetration is analyzed as above, the existence of brand equity is clearly evident. The superior penetration levels that branded properties generally achieve may be the result of the capital-backed media initiatives behind many brands, but this is an aspect of branding itself! This is not to say that raising a flag is conducive to increased revenues, especially considering that the costs associated with a branded environment were not considered. This omission of fee composition was due to the purpose of this article, which was notably to assess an operational impact as apposed to a dollar value. The fact may be that brand equity, when stripped to its foundation, is entirely dependent on the number of people who purchase the brand on a regular basis; if so, intellectual, financial, and media prowess are undoubtedly instrumental to a brand success. The 50% failure rate may attribute to nothing more than a lack of perceived utility. The resources required for developing brands should not overshadow the lucrative potential; but should be allocated in a fashion that positions the brand within the most responsive segments. It is crucial to remember that the "cup is only half full" when branding succeeds on a consumer level and sometimes this may occur before succeeding on a financial one. Theodore Noseworthy is a graduate of Ryerson
University. He is currently working in our Vancouver office but will be
transferred to Toronto later this year.
1 Kim, H; Kim, W. G., & An,
J. A. (2003), The effects of consumer-based brand equity on firms' financial
performance. Journal of Consumer Marketing, 20(5), pp. 335-351.
|
