Hotel Online  Special Report

Hotel Development Cost Can
Determine Feasibility

CANADIAN LODGING OUTLOOK
February  2002 Year to date


The Canadian Lodging Outlook is a joint monthly publication 
of Smith Travel Research and HVS International, 
Vancouver and Toronto, Canada

 
February 2002
By: Stephen Rushmore, MAI, CHA, CRE - HVS International - New York

One of the least understood terms in the hotel/real estate business is "feasibility." What makes one proposed hotel feasible and another not feasible? Some analysts evaluate feasibility by calculating an internal rate of return (IRR) and seeing if the resultant return is sufficient to account for the potential risks. An easier procedure is to compare the economic value of a proposed hotel upon its opening to its total development cost. If it costs more to build than it is worth, then the project is not feasible. When a hotel opens and its value is greater than the cost to build it is considered feasible.

A developer wants to sell the completed hotel for a price that actually exceeds the development cost so a profit can be realized. This profit factor is called a "developer's profit," which typically ranges from 10% to 25%. Considering that most people want to make a profit for their effort, it is normal to include a developer's profit on top of the total development cost when evaluating feasibility.

The process of developing a hotel requires packaging five components - land, improvements, furniture and equipment, pre-opening and operating capital - in a manner that meets the needs and desires of travelers visiting the marketplace. This delicate balancing act requires precise coordination of design, function and cost.

The hotel development process starts with the land acquisition.  Generally, the land component cost represents between 10% to 15% of the total project cost. When land cost exceeds 20%, project feasibility could be in doubt.

The improvements represent the actual building with all its mechanical, electrical and plumbing systems. The cost of the improvements is directly related to construction quality, spatial utilization, design consideration and the local development cycle.  During the building boom of the late 1980s and, to a lesser extent, today increased construction activity produces a more rapid rise in building development costs.

The large amount of furniture and equipment within a hotel is unique to this form of commercial real estate. Depending on whether the property has foodservice or not, the furniture and equipment component generally represents between 10% and 20% of the total project cost. As hotels start installing more expensive technology, expect these percentages to increase, which could affect the balance between cost and value.  Another two components unique to the hotel industry are pre-opening expenses and operating capital. Pre-opening costs include items such as initial marketing, recruiting and training.  For large convention hotels, these, activities can occur years before the property opens and often represent a significant expenditure. Operating capital is the money needed to purchase inventories and supplies. Once a hotel becomes operational, its actual working capital diminishes.
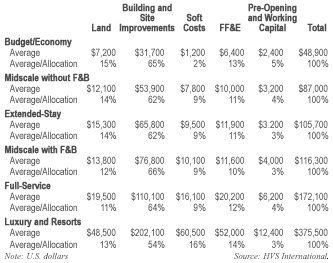


HVS International constantly tracks hotel development costs to evaluate feasibility. Elaine Sahlins and Suzanne Mellen of HVS in San Francisco compiled the following table showing per room hotel development costs for three classes of hotels. This information is part of our annual Hotel Development Cost Survey which can be found on the Internet at www.hvsinternational.com.  As you can see, balancing these five components in a way that design, function and cost are always in sync can be a complex exercise. Success is measured by the amount of developer's profit remaining when you deduct the total development cost from the hotel's economic value on opening day.


CANADIAN LODGING OUTLOOK
HVS INTERNATIONAL - CANADA
February 2002 Year-to-Date
February
2002
Year-to-Date
Number of 
Rooms
Occupancy Rate (%)
2002
Occupancy Rate (%)
2001
Average Room 
Rate ($) 2002
Average Room 
Rate ($) 2001
RevPAR ($) 2002 RevPAR ($) 2001 Room Supply
% change
Room Demand
% change
Nova Scotia
Area
1,311 43.8% 46.2% $69.30 $70.07 $30.35 $32.37 0.3% -4.9%
Halifax, NS 2,599 50.1% 55.9% $97.31 $100.28 $48.75 $56.06 5.5% -5.6%
Montreal, QC 14,998 52.4% 55.9% $128.93 $123.34 $67.56 $68.95 2.2% -4.3%
Quebec City, QC 3,543 51.4% 52.2% $111.57 $102.34 $57.35 $53.42 2.3% 0.7%
Quebec Area 3,338 45.5% 44.3% $79.55 $76.73 $36.20 $33.99 0.7% 3.3%
Toronto
Downtown
11,979 54.0% 55.9% $138.81 $145.60 $74.96 $81.39 0.1% -3.4%
Toronto
North/East
5,751 48.2% 53.0% $108.37 $106.59 $52.23 $56.49 -2.2% -11.2%
Toronto Airport/West 9,026 61.8% 70.6% $116.62 $114.88 $72.07 $81.11 4.3% -8.8%
Ottawa, ON 7,556 55.6% 63.0% $122.07 $126.52 $67.87 $79.71 1.9% -10.0%
Ontario East 5,170 45.8% 47.3% $88.99 $86.01 $40.76 $40.68 0.4% -2.7%
Niagara Falls,
ON
5,320 34.5% 32.0% $87.06 $83.49 $30.04 $26.72 1.4% 9.6%
Ontario
Southwest
6,671 51.5% 52.7% $95.36 $95.44 $49.11 $50.30 0.3% -2.0%
Ontario North 4,481 47.2% 50.5% $83.14 $83.40 $39.24 $42.12 0.3% -6.2%
Ontario Central 5,674 46.1% 50.9% $90.07 $87.30 $41.52 $44.44 1.6% -7.9%
Winnipeg, MB 3,407 53.7% 55.9% $86.88 $89.68 $46.65 $50.13 2.3% -1.8%
Regina / Saskatoon, SK 3,785 53.6% 59.2% $84.19 $80.61 $45.13 $47.72 1.6% -8.0%
Calgary, AB 7,730 53.5% 54.8% $103.96 $104.95 $55.62 $57.51 1.0% -1.5%
Edmonton, AB 5,409 65.9% 60.9% $87.90 $89.82 $57.93 $54.70 0.0% 8.3%
Alberta Area 5,819 51.1% 57.1% $83.60 $77.77 $42.72 $44.41 1.1% -9.5%
Mountain
Regions, AB
1,917 55.7% 56.5% $164.15 $149.61 $91.43 $84.53 -6.8% -8.1%
Vancouver, BC 11,320 48.8% 51.9% $108.53 $111.39 $52.96 $57.81 3.0% -3.0%
British
Columbia Area
4,647 41.3% 36.6% $71.35 $68.21 $29.47 $24.96 0.7% 13.5%
Victoria, BC 2,686 45.3% 43.6% $83.00 $81.79 $37.60 $35.66 1.7% 5.6%
Provinces
Alberta 20,386 56.2% 57.1% $97.63 $97.51 $54.87 $55.68 -0.4% -1.8%
British Columbia 22,581 48.9% 50.0% $129.06 $129.51 $63.11 $64.76 1.5% -0.9%
Manitoba 3,729 54.2% 55.9% $85.66 $88.65 $46.43 $49.56 2.1% -1.0%
New Brunswick 3,069 46.7% 50.1% $84.15 $80.86 $39.30 $40.51 0.0% -6.9%
Newfoundland 1,526 51.7% 54.6% $96.15 $92.43 $49.71 $50.47 0.0% -5.3%
Nova Scotia 3,910 48.0% 52.3% $88.71 $90.24 $42.58 $47.20 1.8% -6.6%
Northwest Territories INS INS INS INS INS INS INS INS INS
Ontario 61,189 51.0% 54.6% $110.70 $111.86 $56.46 $61.08 1.0% -5.6%
Prince Edward Island 887 32.6% 33.3% $62.90 $60.10 $20.51 $20.01 0.0% -2.1%
Quebec 22,318 50.9% 53.4% $118.87 $113.52 $60.50 $60.62 1.6% -3.1%
Saskatchewan 5,279 48.5% 53.3% $79.04 $76.36 $38.33 $40.70 1.1% -8.0%
Yukon Territory INS INS INS INS INS INS INS INS INS
Canada 145,108 48.5% 50.2% $96.11 $95.57 $46.61 $47.98 1.0% -2.5%

© Smith Travel Research, 2001. Reproduction or quotation in whole or in part without permission is forbidden. *INS - Insufficient Data


###

Contact:
Kimberley Tyls
HVS International 
4235 Prospect Road
North Vancouver, BC V7N 3L6
(604) 988-9743, ext. 21
[email protected]
www.hvsinternational.com

Also See Hotel Internet Distribution Channels / January 2002 Month-to-Date Results / Canadian Lodging Outlook / April 2002 
2001 Was a Great Year If You Were in Edmonton! / December 2001 Year-to-Date Results / Canadian Lodging Outlook / Feb 2002 
2001 Canadian Hotel Sales / Canadian Lodging Outlook / Jan 2002 
The Effect on Capitalization Rates and Discount Factors After September 11 / Canadian Lodging Outlook / Dec 2001 
So How Bad Was September for Canadian Hotels.. Pretty Bad! / Nov 2001
So How Bad Was September for Canadian Hotels.. Pretty Bad! / The Canadian Lodging Outlook / September 2001 
Have Hotel Values in Canada Declined Since September 11th? You Bet They Have / The Canadian Lodging Outlook / August 2001 
The Popularity of Boutique Hotels / The Canadian Lodging Outlook / July 2001 
Rising Energy Costs Cause Concern in the Lodging Industry / The Canadian Lodging Outlook / June 2001 
Niagara Falls: With Supply Comes Demand / The Canadian Lodging Outlook / May 2001 
Does Supply Generate Demand? / The Canadian Lodging Outlook / May 2001 
Optimism With a Hint of Caution, As Analysts Predict a Softer Year for the Canadian Hotel Industry / Mar 2001 
Limited-Service Growth in Canada - Where�s it Going? / The Canadian Lodging Outlook / January 2001 
HVS Canada in Review - Year End 2000 / The Canadian Lodging Outlook / March 2001 
Canadian Lodging Outlook / May 2000 Year to Date Statistics / HVS International - Canada / July 2000 
The Rule of Thumb Method...Does It Still Hold Weight? / Elaine Sahlins - HVS / Oct 2000
What�s Hot and What�s Not in Western Canadian Hotel Markets / Mar 2000


To search Hotel Online data base of News and Trends Go to Hotel.Online Search

Home | Welcome! | Hospitality News | Classifieds | Catalogs & Pricing | Viewpoint Forum | Ideas/Trends
Please contact Hotel.Online with your comments and suggestions.