|
|
|
|
|
|
|
- A Critical Review of the Brookings Institution Research Brief on Convention Centers as Economic Development Strategy |
.
| by Thomas Hazinski and Hans Detlefsen, HVS Convention, Sports, &
Entertainment Facilities Consulting / HVS Journal May 2005
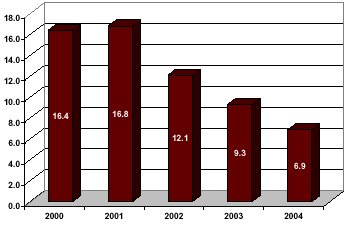
Introduction In January of 2005, the Bookings Institution published a policy brief authored by Prof. Heywood Sanders called Space Available: the Realities of Convention Centers as Economic Development Strategy. Sanders paints a grim view of the convention industry as one in which out of control local government investment in convention center space is underway despite a precipitous and permanent decline in the demand for that space. Sanders describes the state of the industry as an "arms race" in which "local officials are willing to try almost any investment in their quest for more convention visitors." He claims this futile quest is motivated by vested interests1 and their say anything consultants who have consistently exaggerated the potential economic impact of convention center development. Supported by the prestige of the Brookings Institution, the research brief caused a tsunami of bad news for the industry as it washed over most major newspapers and some important periodicals. A soon to follow article in Forbes Magazine2 sent an aftershock. Subsequent media citations or personal appearances by Sanders in many cities that are considering convention center or related hotel development has propelled him into the position as the leading opponent of public investment in convention centers. Opponents of specific convention center investments have cited his findings as they seek to prevent public investment in convention centers and convention center hotels in their communities. Many industry leaders and analysts disagree sharply with the Sanders� view3. At the same time they acknowledge that the industry has experienced considerable stress since at least 2001. Most convention center managers, tradeshow service providers, convention and visitor bureau directors, and event planners would concede that their jobs have been made more difficult, and success more limited, by an industry downturn. In this context, Sanders� dramatic portrait of an industry in crisis is bound to be unsettling. The question is whether Sanders paints an accurate picture of the state of the industry. A realistic view of the future of the industry is important because this view influences capital investment decisions and the fortunes of those who make a living planning and servicing convention center events. Sanders marshals a plethora of data to support three general claims regarding the direction of the industry: 1) demand for convention and tradeshow space has plummeted and this decline is permanent because the industry has fundamentally changed4; 2) over the past decade public capital investment in convention centers has accelerated ("doubled over the past decade"5); and 3) in an apparently irrational attempt to improve their performance, cities are "throwing good money after bad" particularly by investing in convention headquarters hotels6. This paper will analyze the validity of each of these claims and present an alternative view of industry trends in demand, supply, and public investment in hotels. Trends in Demand Dismissing available national data on trends in demand as "scant, murky, and of limited reliability," Sanders nonetheless relies on data from Tradeshow Week on exhibit space and attendance of the 200 largest tradeshows (the "Tradeshow 200") over the period from 1991 through 2003 as a basis for making his broad based "portrait of a faltering industry." This turns out to be a questionable choice because it produces a biased sample that misrepresents trends in the industry as a whole. In any given year, this sample consists of only 200 of the approximately 4,800 events tracked by Tradeshow Week, roughly 4 percent of the available Tradeshow Week data. In terms of exhibit space rented in 2003, the Tradeshow Week 200 represents roughly 62 million square feet of net exhibition space used7 of over one billion net square feet tracked by Tradeshow Week. Furthermore, the whole of the Tradeshow Week database represents a subset of all events that occur in exhibit space in convention and exhibition centers in the U.S. The Tradeshow Week database is limited to tradeshow and exhibition events of 5,000 net square feet or more that Tradeshow Week tracks. Nobody knows precisely how many events use exhibit space in the U.S. each year. But to get an idea of the order of magnitude, suppose that the average convention center hosts 40 events that use exhibit space each year8. Given that there are 442 convention and exposition centers in the U.S.9, the total number of events using exhibit space is roughly 18,000 events each year. So the sample size of the Tradeshow Week 200 is somewhere around one percent of all events. A small sample size could theoretically produce an accurate estimate of the behavior of the industry as a whole, but only if it is a representative sample. To be representative of the industry as a whole such a sample would, among other considerations, have to mirror the distribution of event sizes actually occurring in the industry. But the Tradeshow 200 is not intended to be a representative sample, only capturing the very top end of the size distribution. This rather basic methodological error undermines the validity of Sanders� attempt to obtain "a broad overview of the national trends." In the trends of the Tradeshow 200 (1991 through 2003), Sanders finds evidence of a "precipitous decline" in the industry as a whole. He concludes that the industry has been in decline since the mid-1990s -- well before the economic downturn and political events of 2001. However, the data do not support this contention even if one were to apply it more narrowly to only the Tradeshow 200. While attendance peaked in 1996, net square feet of exhibition space peaked in 2000, before the onset of an eight month national economic recession and the events of September 11. Sanders side-steps the more plausible and commonly accepted explanation that the Tradeshow 200, like the stock market, was riding the "dotcom" and telecommunication "bubble" of the late 1990s and collapsed along with it. In addition to his reliance on a small and unrepresentative sample of events, Sanders goes further, stating unequivocally that these data do not show the "real magnitude of convention and tradeshow change." To bolster an even broader argument that the convention and tradeshow industry is in the process of "structural change" and permanent decline, Sanders compiles data on events, attendance and room nights generated at 19 of the 442 convention centers in the U.S.10 Among all the events that may use exhibition space, Sanders singles out "conventions and tradeshows" excluding consumer shows and other events that may occur in exhibition space. The purpose of this selectivity is to highlight the trends in events that have more potential economic impact because they generate a high rate of out of town visitation. While this is a reasonable point of focus, the fact that it is a subset of events should further call into question Sanders� conclusions about the overall level of exhibition space utilized. The data on the 19 cities are not consistently presented for the same years. In some cases Sanders analyzes center attendance data and in others room nights generated. Use of room night data adds another layer of complexity because room night data usually relies on information from hotel room block reservations and actual use of those room blocks. Event planners� requests for room blocks have decreased in recent years in part because attendees are using the internet with increasing frequency to directly book rooms. These direct bookings often do not get counted in estimates of room nights. He presents data on nine of these facilities in charts throughout the article. Sanders does not present any aggregate data, rather, he draws general conclusions from anecdotal narratives on each facility. In our view the data on these 19 selected facilities cannot be properly construed to support Sanders� argument that the structural change in demand for convention centers began in the mid-1990s. The data show erratic variations in attendance in each facility from year to year through the 1990s until 2000, after which most (but not all) of the convention centers in Sanders� sample experienced declines in attendance or room nights. Using data from the nine of the 19 facilities that Sanders illustrated in charts11, we calculated the aggregate annual percent change in attendance or room nights for these facilities. The results are illustrated in the chart below. Percent Change in Attendance or Room Nights
for
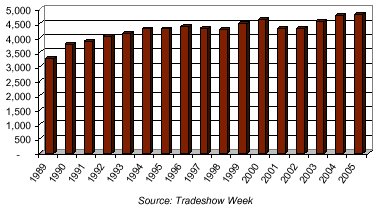
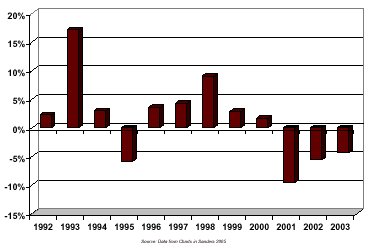 The pattern shows growth throughout the 1990s� with the exception of 1995. A sudden drop occurred in 2001 and the percentage rate of decline slowed in 2002 and 2003. Aggregated, Sanders� own data do not support his conclusion of "structural change" beginning the mid-1990s. The state of the economy and geo-political events that followed September 11, 2001 seem like more plausible explanations. However, the more fundamental problem in using Sanders� data on 19 facilities to make general inferences about demand in the industry as a whole is that it does not take into account the increase in competitive supply that occurred over the past decade. If supply is increasing at a rate faster than demand, as Sanders himself contends, then one would expect the utilization of some convention centers to decline. Utilization rates alone tell us nothing about industry-wide demand unless we also factor in the effects of changes in supply. Drawing on a third source of even more narrowly selective data, Sanders points to dramatic decreases in attendance at individual tradeshows such as CONEXPO, the National Hardware Show, and COMDEX. Although admitting that "a few sectors did see increases in tradeshow activity" he cites no examples of events that experienced an increase in attendance of over the past few years. In 2004, six events in the Tradeshow 200 increased their use of exhibit space by more than 20 percent12 and many others grew more modestly. Sanders� selective focus on negative change may inform us about specific events or facilities, but does little to develop an understanding of overall industry trends. An Alternative View of Demand Trends Sanders dismisses as inadequate13 more comprehensive Tradeshow Week trends data14 that is widely used to measure industry performance. He correctly points out that this data has its limitations. It relies on surveys of individual events and estimates of attendance to generate projections of attendance and space utilization for all of the events Tradeshow Week tracks. Ideally, one would prefer to have actual reported data on all 4,800 events because the survey and estimation process may introduce some systematic bias. However, the Tradeshow Week data have been collected and analyzed the same way since 1972. Assuming the same collection and analytic procedures are used each year, any systematic bias would roughly be the same from year to year. Precisely because the methods used to create this data do not change over time, it is highly useful in understanding long-term trends in the industry. Analysis of the Tradeshow Week data shows that convention center demand declined in 2001 and 2002, but demand rebounded in 2003 or 2004. Is this evidence of a fundamental shift in industry demand? Or is this evidence of a "bubble" and "correction" similar to what occurred in other markets during the same time period? Tradeshow Week has collected data on the total number of exhibition events that use at least five-thousand net square feet since 1989. HVS illustrates annual trends in the number of exhibition events in the chart below. Number of Events 1989 - 2005
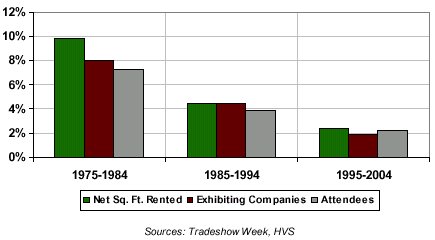
Three additional important industry measures of demand include: 1) the amount of exhibit space rented by exhibitors, or net square feet ("NSF"); 2) the number of exhibitors or exhibiting firms that rent space; and 3) annual attendance. To obtain this data, Tradeshow Week conducts quarterly surveys of 400 events (believed to be a representative sample) that use at least 30,000 net square feet of exhibit space. Looking at the annual average percentage increase from one decade to the next illustrates the long-term trends as shown in the figure below. Long-term Trends
A closer look at what has happened in the past 10 years supports the view that demand measures used in the convention industry are roughly in line with other measures of national economic growth. Average Annual Percent Change 1995 - 2004
The decline in all three measures in 2001 and 2002 are indeed remarkable, because these years are the first to show an overall industry contraction. An industry that was once immune to the effects of economic cycles now finds itself exposed to periods of negative growth and overall lower long-term growth rates. These are sobering trends, but should not be characterized as an industry collapse. The data also indicates some recovery in demand in 2003 and 2004. Trends in Supply The data on the supply of exhibition space are clearer than the data on exhibition space utilization because it is much more easily tracked. On this point Sanders is more guilty of mischaracterizing the data rather than using it selectively. He claims that the last few years "have seen a remarkable boom in the volume of exhibit space in convention centers," calling it a "building frenzy." A long term view of the growth in supply is illustrated below. Average Annual Percent Change in Exhibit Space
The rapid growth rate in the early part of this decade may well be explained by the success of the 1990s when many of the currently proposed facilities and expansions were planned. Because convention center projects typically require long periods of consensus building, governmental approvals, design, and construction, five- to ten-year planning horizons are not uncommon. Sanders claims "there is no evidence that the convention center building boom is over or even seriously slowing." Consider the following data illustrated below, once again from Tradeshow Week.15 Planned New or Expanded Exhibition Space
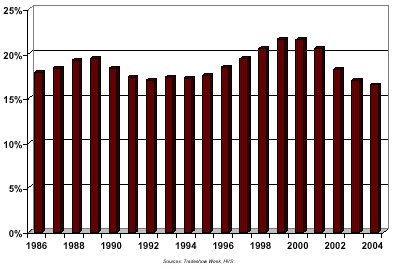
Utilization Trends By expressing the ratio of demand to supply, one can calculate a utilization factor for convention centers. This is similar to occupancy rates that are used to measure performance in the hotel industry. The utilization factor reflects the percent of gross exhibit space that is used each year by the events that are tracked by Tradeshow Week. Utilization Index
The calculated utilization factor, admittedly, does not represent the overall amount of space facilities rent out because they host more than just the events tracked by Tradeshow Week. Tradeshow Week tracks only conventions, tradeshows, and some consumer shows that use at least 5,000 net square feet of exhibit space. Examples of other events that could take place in convention centers include religious assemblies, graduation ceremonies, job fairs, social gatherings, banquets, and sporting events as well as musical and entertainment shows. Therefore, overall utilization is likely to be higher than the utilization factor presented here, even though these additional types of use generally do not represent high-impact events for which most convention centers are intended. Moreover, demand is not distributed evenly throughout the existing supply. Most successful convention centers experience overall utilization rates in the range of 40 percent to 60 percent of capacity. Other less successful venues are extremely underutilized. Good Money after Bad? A number of cities have chosen to improve their convention environment by investing in the development of headquarters hotels. Sander says, "Many cities wind up, as they say �throwing good money after bad�." This assertion implies that the original investment in a convention center is a bad one (a claim that most cities that have made the investment would dispute) and that hotel investment is just adding more of the same type of public costs. But the rationale for, and expected financial outcomes of, convention center and hotel investments, are quite different. The most commonly used rationale for investment in convention centers is to generate economic impacts from out of town visitation. Nearly all convention centers in the U.S. are built without any expectation that project income will repay capital costs and most are not even expected to cover operating expenses. This has long been a fact of life in convention center development, although Sanders implies that convention center financial losses are a new and growing problem. In contrast, the rationale for public investment in hotels is to maintain competitiveness (not necessarily to generate new economic impact) and they are usually expected to pay for their capital costs from project income. In fact, all publicly financed hotels are expected to provide a significant return on investment to the sponsoring municipality in the form of residual cash flows and potential sale of the asset. Since 1996, sixteen communities have successfully financed hotels using tax-exempt municipal debt. All of them planned to repay that debt with project income. The choice to use public rather than private financing is driven by the lower costs of tax-exempt funds which makes projects more feasible with less financial commitment on the part of the sponsoring municipality. Three of the early projects in Chicago, Sacramento, and Miami Beach have already fulfilled their promise to generate a financial return. Others more recently financed such as in Austin, Overland Park, and Cambridge are on their way to providing a financial return despite opening under stressful market circumstances. For other more recent developments, it is still too early to know how they will perform. Sanders focuses exclusively on a notable failure in St. Louis to demonstrate the negative fiscal impacts of convention center and hotel investments. An explosion of new public investment in headquarters hotels is not likely, as these types of deals have become increasingly difficult to complete. The failure of the St. Louis Renaissance project to produce sufficient revenues to pay debt service has had a particularly important influence on how rating agencies and municipal bond insurers view these transactions, setting a higher bar for investment grade ratings and participation by third party guarantors. A rising interest rate environment could also curtail investment. A Mature Industry If convention and tradeshow demand is not in permanent decline and if supply is not growing faster than ever as Sanders claims, what is a realistic assessment of the status of the industry? Over the past three decades, the meeting and convention industry has evolved dramatically from a budding industry to a mature one, entering a new stage of the industry�s lifecycle. Historically rapid growth in the supply of exhibit space has allowed rapid growth in the industry, as groups that formerly had no appropriate exhibition venue available, now have many facilities competing for their business. A declining growth rate may be a signal of a maturing industry. But it does not imply the industry is in decline. As previously planned new exhibition space comes on line throughout the rest of this decade, competition for business is likely to remain fierce. In the later part of this decade, if demand continues to recover and the rate of new supply decreases, the utilization of convention facilities may once again grow. Until then, the effect of increasing competition is likely to vary greatly from city to city. Those with a strong package of convention facilities, location, access, marketing efforts, technology, and overall destination appeal will succeed, while other cities will struggle to find an appropriate market niche. As an established industry, continued growth in demand will come not from latent sources, as occurred during the last few decades. Rather, industry growth will depend on new demand, which is affected by numerous factors such as the cost of travel, the importance of face-to-face interaction in certain industries, improvements in facility design, resources available to promote events, trend in how firms allocate their marketing budgets, and overall growth trends in the national economy. In most industries that go through periods of overbuilding (e.g. hotels, residential, shopping malls, and office space), the ability to generate private return on investment eventually limits the expansion of supply. Since most convention facilities are publicly financed, this market discipline is not necessarily present. Instead limited resources of governments and the public decision making processes that consider the merits of capital investment place limits on supply growth. In our experience, most municipalities are not "willing to try almost any investment in their quest for more convention visitors." Concern over the proper allocation of limited resources and historical experiences of success and failure play very important roles in the decision making process. Which brings us to a point of agreement with Sanders� overall conclusions: careful and realistic consideration of the chances of success should inform the public decision making process about investment in convention centers. 2 Victoria Murphy, �The Answer Is Always Yes�, Forbes Magazine, February 28, 2005. 3 The Brookings Report, TSW Readers Have Their Say, Tradeshow Week, February 28, 2005 included comments from twelve industry leaders that were all critical of Sanders� findings. 4 Sanders, Heywood, Space Available: The Realities of Convention Centers as Economic Development Strategy, The Brookings Institution, January 2005, p. 16. 5 Ibid., pp. 1 and 8. 6 Ibid., p. 21. 7 Net exhibition space is the amount of exhibit space rented by exhibitors which is typically around 50 percent to the total exhibit space required for the event. 8 This estimate includes consumer shows, civic, entertainment, and other events that may use exhibition space that Sanders specifically excludes from this analysis. An assumption of 40 events each year that average three days each implies a relatively low annual exhibit hall occupancy rate of around 30 percent. 9 Source: Tradeshow Week Major Exhibit Hall Directory, August 2004 includes facilities with over 25,000 square feet of exhibition space. 10 The cities include Chicago, New York, Atlanta, New Orleans, Las Vegas, Boston, Orlando, San Francisco, Baltimore, Indianapolis, Washington DC, Dallas, Charlotte, Cincinnati, Houston, Los Angeles, Philadelphia, San Jose and Phoenix. 11 Since Sanders did not provide all the specific data points, we relied on a reading of the graphics to generate the data. 12 Nightclub, Bar & Beverage Retailer Convention & Tradeshow � 36.8% increase; National Automotive Dealers Association Convention & Exposition � 30.5% increase; Electronic Distribution Show & Conference � 25.0% increase; Premiere Beauty & Hair Show � 22.8% increase; National Cable & Telecommunications Association Tradeshow � 22.3% increase; and Medical Design & Manufacturing Show � 20.3% increase. 13 Sanders, Heywood, Space Available: The Realities of Convention Centers as Economic Development Strategy, The Brookings Institution, January 2005, p. 3. 14 Tradeshow Week Data Book, Annual Editions, Reed Business Information. 15 Tradeshow Week Major Exhibit Hall Directories from 2000 through 2004.
|
.

 THOMAS
HAZINSKI is the managing director of HVS Convention, Sports &
Entertainment Facilities Consulting in Chicago, Illinois. His consulting
practice is dedicated to the market and financial analysis of public assembly
facilities. Mr. Hazinski has 18 years of experience in the public policy
arena, as both a public official and a consultant. He specializes in providing
economic and financial research to public agencies involved in economic
development initiatives. Before starting his consulting career, Mr. Hazinski
served in several positions for the City of Chicago, including assistant
budget director. In this capacity, he managed the city�s revenue analysis
unit and was responsible for revenue estimation, legislative review, and
fiscal impact analyses for numerous city projects. Mr. Hazinski holds a
master�s degree in public policy from the University of Chicago�s Harris
School of Public Policy. Email:
THOMAS
HAZINSKI is the managing director of HVS Convention, Sports &
Entertainment Facilities Consulting in Chicago, Illinois. His consulting
practice is dedicated to the market and financial analysis of public assembly
facilities. Mr. Hazinski has 18 years of experience in the public policy
arena, as both a public official and a consultant. He specializes in providing
economic and financial research to public agencies involved in economic
development initiatives. Before starting his consulting career, Mr. Hazinski
served in several positions for the City of Chicago, including assistant
budget director. In this capacity, he managed the city�s revenue analysis
unit and was responsible for revenue estimation, legislative review, and
fiscal impact analyses for numerous city projects. Mr. Hazinski holds a
master�s degree in public policy from the University of Chicago�s Harris
School of Public Policy. Email:  HANS
DETLEFSEN is a Senior Manager at HVS Convention, Sports & Entertainment
Facilities Consulting in Chicago. He consults for public and private clients
seeking to plan, develop, and operate recreational, entertainment, and
convention facilities, and his assignments primarily include assessing
the market and financial feasibility of these projects. Previous to this
appointment, Hans consulted for Economics Research Associates (ERA), a
firm that specializes in entertainment and recreation market analyses and
feasibility studies. Before starting his consulting career, Hans served
as Special Assistant to the Lieutenant Governor of Indiana. He also holds
a Masters Degree in Public Policy from the Harris School of Public Policy
at the University of Chicago, where he received the Harris Fellowship.
He graduated magna cum laude from the University of Notre Dame with a Bachelor
of Arts in Government and Economics. Email:
HANS
DETLEFSEN is a Senior Manager at HVS Convention, Sports & Entertainment
Facilities Consulting in Chicago. He consults for public and private clients
seeking to plan, develop, and operate recreational, entertainment, and
convention facilities, and his assignments primarily include assessing
the market and financial feasibility of these projects. Previous to this
appointment, Hans consulted for Economics Research Associates (ERA), a
firm that specializes in entertainment and recreation market analyses and
feasibility studies. Before starting his consulting career, Hans served
as Special Assistant to the Lieutenant Governor of Indiana. He also holds
a Masters Degree in Public Policy from the Harris School of Public Policy
at the University of Chicago, where he received the Harris Fellowship.
He graduated magna cum laude from the University of Notre Dame with a Bachelor
of Arts in Government and Economics. Email: