|
|
|
|
|
|
--
|
2001 This edition is produced by the London Office of HVS International |
| Dominique Bourdais, Justin Lanzkron and Yannick Simonart, May 2001
Highlights
hotel value (local currency)  Introduction The HVI is a sophisticated hotel valuation benchmark developed by HVS International. It monitors annual percentage changes in the values of, mainly, four-star and five-star hotels in 29 major European markets. Additionally, our research allows us to rank each market relative to a European average. In addition, the HVI reports the average value per room, in euro, for each market. In this year�s HVI, we have included two new markets: Birmingham and Manchester. Thus, the number of markets covered by the HVI has grown to 29. We have responded to the many requests that we have received from developers, investors, lenders and others interested in hotel value trends in the European arena to expand the breadth of our annual report. The methodology employed in producing the HVI is based upon actual operating data from a representative sample of four-star and five-star hotels. The data are then aggregated to produce a pro forma performance for a typical 200-room hotel in each market. Based upon our day-to-day experience of real-life hotel financing structures, which arises from our in-depth knowledge gained during hundreds of assignments each year, we have determined appropriate valuation parameters for each market, including loan to value ratios, relevant interest rates and equity return expectations. These market-specific valuation / capitalisation parameters are applied to the net income for a typical hotel in each city. In determining the valuation parameters relevant to each of the 29 European markets included in the HVI, we have also taken into account evidence of real hotel transactions and the expectations of investors with regard to future changes in supply, market performance and return requirements. Investor appetite for each market in 2000 is reflected in the capitalisation rate used in the HVI. The HVI assumes a date of value of 31 December 2000. Values are based on historical market performance but the capitalisation rates reflect the anticipated future trends in performance, competitive environment, cost of debt and cost of equity. The HVI allows comparisons of values across markets and over time by using the 1993 average European value of c = 145,812 per available room (PAR) as a base (1993=1.000). Each market�s PAR value is then indexed relative to this base. For example, in 2000 the index for London was 3.781(c = 551,308/c = 145,812), which means that the value of a hotel in London in 2000 (c = 551,308 PAR) was approximately 3.8 times higher than the European average in 1993. In order to calculate the euro equivalent values for 1993 to 1998, the value for each city was converted into Deutschmarks (DM) at the prevailing (annual average) exchange rate and then converted into euro at the fixed 1 January 1999 DM/euro exchange rate (1.95583). The values for new markets added to this year�s HVI have been calculated for the last three years only, ie the period for which we have obtained consistent operating data. Table 2: Average Annual Compounded Growth Rate
Source: HVS International
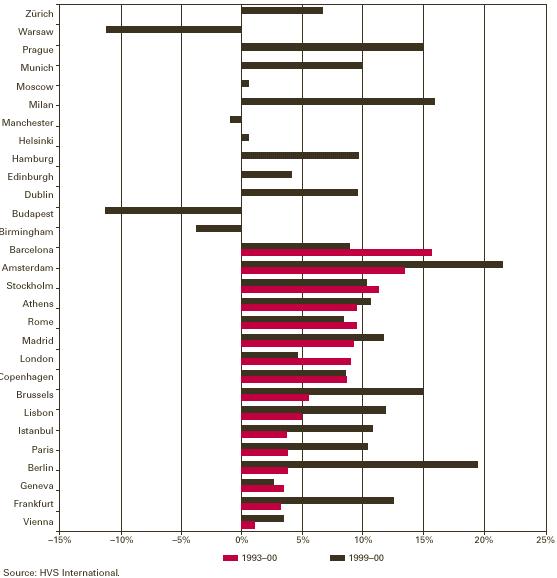
Changes in Value 1999�2000 (Local Currency) The following paragraphs discuss changes in hotel values between 1999 and 2000. We have considered operating performance and value in local currency; however, for Budapest, Istanbul, Moscow, Prague and Warsaw we have used US dollars. For comparative purposes, and in order to calculate indices, we have converted local currency/US dollar values to euro. Thus, for markets in the Euro-zone, the changes in value of the local currency are the same as the changes in value of the euro. However, for markets outside the Euro-zone, there are differences between the changes in value reported in euro and changes in value reported in local currency/US dollars. Where this difference is significant, we have commented on the variation. Our report shows that hotel values (expressed in local currency per room) rose by 7.6% across Europe in 2000 compared with 2.7% in 1999, 9.1% in 1998, and 12.0% in 1997 (Table 3). During 2000, the majority of European markets experienced strong growth in rooms revenue per available room (RevPAR), led largely by increases in average rates. Thus, it would appear that aggregate European hotel values have begun to grow more significantly after experiencing a general slowing down in 1999; however, the increase in 2000 is not as strong as it was in 1998 and 1997. The general increase in value growth indicates that some markets have still not reached the top of their cycle, while other markets that have historically witnessed moderate growth or even decreases in value experienced, in some cases, substantial increases. Interest rates in the euro-zone, the UK and the USA went up in the first half of 2000 and long-term interest rates (ten-year swaps) followed suit. The latter part of 2000 was characterised by a decline in base rates initiated by central banks in Europe and the USA in response to economies slowing down and a potential recession in the USA. Ten-year euro swaps in January 2001 were down by approximately 0.5% compared to January 2000. Equity yields have tended to rise in the latter part of 2000 reflecting investors� concerns about the impact of the troubled US economy on Europe. On balance capitalisation rates have remained stable as at 1 January 2001 compared to the same time last year. On balance, capitalisation rates in 2000 have remained static. Despite this, values have in many cases increased significantly, mainly as a result of growth in RevPAR. The general increase in value growth is demonstrated by the fact that around half of the 29 cities experienced double-digit value growth in local currency, compared with only 18% in 1999. Of the 29 cities in 2000, 23 showed increases in value while only six recorded decreases in value or a change close to zero. Lisbon and Istanbul, which last year showed decreases in value of �2.7% and �28.2% respectively, recorded double-digit increases in value of 12.4% and 11.0%. Budapest and Warsaw, which showed moderate growth last year of 0.8% and 3.0% respectively, recorded double-digit decreases in value of �10.6% and �10.8% respectively in 2000. Some cities that showed mediocre or low growth in 1999 recorded double-digit growth in value in 2000, notably Brussels (15.3% in 2000 compared with 2.5% in 1999) and Frankfurt (12.9% in 2000 compared with 4.0% in 1999). Amsterdam hotels achieved the highest growth in value per room (local currency) with an increase of 21.9%. As a result of a strong trade fair year at the RAI, the Euro 2000 Football Championships and strong barriers to entry for new hotel operators, hotel trading has been exceptional. Hotel occupancies and increases in average rate pushed RevPAR up by over 20%. Berlin hotels recorded the second- highest growth in value in our survey at 19.9%. Berlin is still clearly benefiting from the relocation of the government. This, together with the Expo fair in Hanover and the strength of the Berlin �Messe� in 2000, has increased visitation to the new capital. There is still a large amount of new supply entering the market, but the new stock that opened in 1999�00 is being absorbed by the strength of demand. In Rome hotels occupancy levels remained high, in excess of 75%, with average room rates increasing by 9.0%, resulting in growth in RevPAR and value. Milan hotels recorded strong growth in RevPAR and value, which was led largely by increases in average rate; occupancies for the city were near capacity. Brussels hotels featured among the leaders in growth in value (15.3%). In Brussels the increase in value was led largely by an increase in average rates, with occupancies being near capacity. The Brussels hotel market continued to record strong growth, driven by rising demand and a limited increase in new supply. The Euro 2000 Football Championships and strong con-ference business helped to drive up hotel demand. Frankfurt hotels recorded strong growth in RevPAR and value, which was led largely by increases in average rate. This strong growth can be attributed to the excellent trade fair demand during 2000 and to the financial and consulting companies, which generate a significant level of con-ference and corporate demand for the city�s hotels. Lisbon hotels recorded strong growth in value per room of 12.4%. Lisbon�s hotel market has made a quick recovery from the effect of the rise in new supply in 1998, generated by the Expo, which resulted in a 2.7% decrease in value in 1999. Until 1998, the Turkish economy and the rise in tourist arrivals provided an encouraging environment for the tourism industry in Istanbul. However, events in 1999 (mainly the war in Kosovo, the arrest of Abdullah Ocalan and the subsequent series of bomb attacks, and, ultimately, the earthquakes) resulted in a 40% decline in RevPAR. Istanbul showed a similar decrease in hotel values in that year. In 2000 Istanbul recorded strong RevPAR growth of 41.7%, which was led largely by an increase in occupancies after a very poor trading year in 1999 resulting in a growth in value of 11%. It must be noted that our valuations are assumed to be as at 31 December 2000 and without the benefit of foresight. The devaluation of the Turkish lira in 2001 could not have been foreseen at that time and the effect of this is there-fore excluded from any considera-tion as far as 2000 is concerned. Table 4: Hotel Valuation Index 1993-00
Source: HVS International The Greek hotel market suffered a troublesome 1999, due to the Kosovo crisis and natural disasters; however, the past year has seen a strong recovery. Athens hotels recorded strong growth in RevPAR and value (10.7%), which was led largely by increases in average rate and occupancies. Optimism there is also buoyed by the anticipation of the effects of the 2004 Olympic Games. However, there are a large number of hotel projects either planned or under construction in anticipation of a rise in demand due to the Games. This is likely to result in a glut of hotel supply in 2004. Investors are therefore unlikely to pay a premium. Paris hotels recorded strong RevPAR growth fuelled by increases in average rates, which resulted in a growth in value of 10.4%. Demand for hotel accommodation in the French capital continues to enjoy strong growth. The supply of hotel accommodation is unlikely to grow significantly in the foreseeable future. Occupancy levels are therefore anticipated to remain high and average rates are expected to continue to rise at a rate above inflation. Madrid, Stockholm, Munich and Hamburg hotels all showed strong increases in value due to increases in RevPAR. Capitalisation rates used for these markets have not changed significantly except to reflect interest rate cuts as previously discussed. From 1995 to 1999, Barcelona hotels experienced consistently strong double-digit increases in value. In 2000, the increase was only 9.0%. The strong trading conditions in Barcelona have provided the motivation for new hotel developments, with a significant amount of new projects planned to open over the next three to four years. Although Barcelona continues to experience strong increases in average rate, room occupancy looks as though it has reached its peak at approximately 84%. In 1999 Budapest hotels saw an 11% growth in RevPAR, expressed in Hungarian forints, which equated to an increase in RevPAR of 1.1%, expressed in US dollars, due to the depreciation of the forint against the dollar. In 2000, Budapest saw a decrease, in US dollar values, of �10.6% driven by a decrease in RevPAR of �10.0%. RevPAR growth, in forint values, was actually 8.0%. The supply of quality hotels in Budapest had remained static until three new hotels opened in 2000. There is also a significant number of new hotel developments planned to open over the next two to three years. Prague hotels featured among the leaders in growth in value (15.1%). In 1999, Prague saw an increase, in US dollar values, of 6.4% driven by an increase of RevPAR of 3.7%, although RevPAR growth, in koruna values, was actually 6.0%, due to the depreciation of the koruna against the dollar. In 2000, Prague saw an increase, in US dollar values, of 15.1% driven by an increase of RevPAR of 11.0%, although RevPAR growth, in koruna values, was actually around 30%. After two years of decreases in value, Edinburgh hotels experienced moderate increases in RevPAR and value growth of 4.7%, led largely by increases in average rates, with occupancies near capacity at around 74%. London also recorded moderate increases in RevPAR and value growth after two years of decreases in value. Occupancy remained relatively stable, while average rates in London remained strong throughout 2000 with increases above the rate of inflation, thereby producing a corresponding rise in overall RevPAR. Manchester experienced a slight decline in value of �0.6%. The previously strong growth performance recorded by Manchester�s hotels has been dampened by the new supply entering the market over the past two years, which has affected both occupancies and average rate. Birmingham hotels also experienced a decline in value of �3.4%, due largely to the recent increase of hotel supply in the market. Although the Russian economy has shown improved performance over the
last two years, the financial crisis of 1998 has left its mark. Economic
uncertainties and safety concerns continue to affect the Moscow hotel market.
Business travel demand has been low as many companies stopped investment
activity and cut travel budgets to a minimum. Despite decreases in room
rates, occupancies have remained low, ranging from only 25% to 50% in many
hotels in Moscow. After two years of declining value, Moscow has, in 2000,
shown a state of stagnation, but, admittedly, no decline in value with
negligible growth of 0.1%. Significant demand in the hotel sector, particularly
at the quality end of the market, has accompanied economic growth and stability
in Warsaw during the past decade. However, the Russian economic crisis
of 1998 and the conflict in Kosovo in 1999 have resulted in a decline in
hotel demand. Warsaw recorded a decline in US dollar RevPAR of �8.8% in
2000, which was caused by a decrease in both occupancy and average rate.
We have also increased capitalisation rates in this year�s HVI to reflect
the difficult trading conditions in the Warsaw hotel market, as a result
of the current economic situation in Warsaw, resulting in a decline, in
US dollar values, of �10.8%.
Barcelona continues to head the list of cities for growth in value (see
Table 3), having seen the
Source: HVS International Table 6: Hotel Value per Room in euro
Outlook For 2001, we predict continued increases in European hotel values, although
growth is expected
Acknowledgements
Dominique Bourdais is a Director with HVS International�s
London Office, specialising in hotel
Justin Lanzkron is an Associate with HVS International�s London
Office, specialising in hotel
Yannick Simonart is an Associate with HVS International�s
London Office, specialising in hotel
© 2001 HVS International. All rights reserved. |
|
HVS International Justin Lanzkron Associate Tel: +44 20 7878 7707 [email protected] 14 Hallam Street London W1W 6JG ENGLAND www.hvsinternational.com |
| Also See | HVS International - Main Index / Hotel Online Ideas and Trends |
