As the hotel industry continues on the path toward a downturn, it’s time to begin looking at warning signs for which markets are poised to experience a large drop.
By Jack Corgel, Managing Director, CBRE Hotels’ Americas Research
At a recent gathering, I was involved in a group conversation with hotel property investors who agreed that they have been "choking on the numbers" in certain U.S. hotel markets. Stated differently, their spreadsheet models explode once either acquisition prices or development costs are entered to evaluate hotel opportunities, especially in red-hot markets.
They asked, "Should we pay such high prices now, given that the boom may turn into a bust?" As a college professor, I offered the standard response: "It depends, what do you think?" As a hotel market forecaster, I promised to think and write about hotel property market bubbles with regard to their questions, and likely those of others, about current pricing in local markets.
Boom and bust experiences over the past few decades—with tech stock prices and housing prices, for example—have generated an avalanche of books and articles about short-term, extraordinary asset pricing volatility. A summary of these writings appears as follows:
- The grand debate centers on whether asset price bubbles either emerge from rational responses to fundamental stimulants by market participants or from irrational behaviors, such as sentiment and over-optimism, not directly related to fundamentals (see surveys by Glasser and Nathanson, 2014; and Mayer, 2011).
- The other grand debate involves measurement. The time-honored definition of a bubble is when asset prices markedly depart from fundamental values. The analysis machinery becomes clogged when trying to deal with the term "markedly depart" and further challenged with attempting to compute "fundamental values." Hence, no firm conclusions have been reached about how to detect bubbles ex ante. Ex post detection is far easier, in some cases like a slam dunk into a five-foot-high basket!
- Credit excesses have been found to be instrumental in the creation of many, but not all, asset market bubble cases (see Levitan and Wachter, 2013). Non-credit causes come in many different flavors. Examples of housing market bubbles from non-credit related causes include supply-side constraints and demand factors such as income instability, and social interaction issues (see Jorda, Schularick and Taylor, 2016).
- All of the research on real estate bubbles focuses on housing markets except Levitan and Wachter (2013), who laid the blame on mortgage credit excesses in pricing of commercial real estate during the last cyclical peak. To my knowledge, no publications have addressed hotel market bubbles.
Positive economics spin
Nobel Laureate Milton Friedman championed the cause of positive economics in the context of model building by postulating that a model should be evaluated based on how well it predicts rather than on the elegance of its underlying assumptions.
An analog for market bubble investigation is that the focus ought to be on timely identification and warning signals instead of whether they originate from rational or irrational behaviors as in much of the academic work on the subject. As a practical matter, it is more important to know when a bubble has formed than how it was formed. Also because of the macroeconomic policy implications, studies predominately examine national market booms and busts. Localized bubbles are not often referenced, but to participants in markets for fixed-location assets such as hotel properties, extraordinary pricing at the city level has important return implications (see Bourassa, Hoesli and Oikarinen, 2016).
Bubble measurement
Without the benefit of proof-positive models of fundamental values, the operative metrics become simple ratios of prices divided by incomes. Prices should not markedly depart from incomes in either a long-run average or some relative context. Thus, abnormally large, period-specific ratios signal the possibility of bubble formation.
The relevant metric in the stock market is some variation of a price-earnings ratio. For housing markets, the house price-to-household-income ratio is most often applied and found to be most useful (Bourassa, Hoesli and Oikarinen, 2016). The equivalent metric in commercial real estate market cases including hotels logically would be the reciprocal of the capitalization rate (1/R) – the net operating income multiple.
Hotel market bubble report card
CBRE Hotels' Americas Research manages a repository of data from in-house collections, STR and RERC that allow for the computation of values for a typical hotel in the U.S. and each of the 60 city markets included in the firm's Hotel Horizons forecasting platform. The values come from income capitalization and can be calculated for the most recent quarter, any quarter in the past several decades, and future periods using NOI and capitalization rate forecasts. (STR is the parent company of Hotel News Now.)
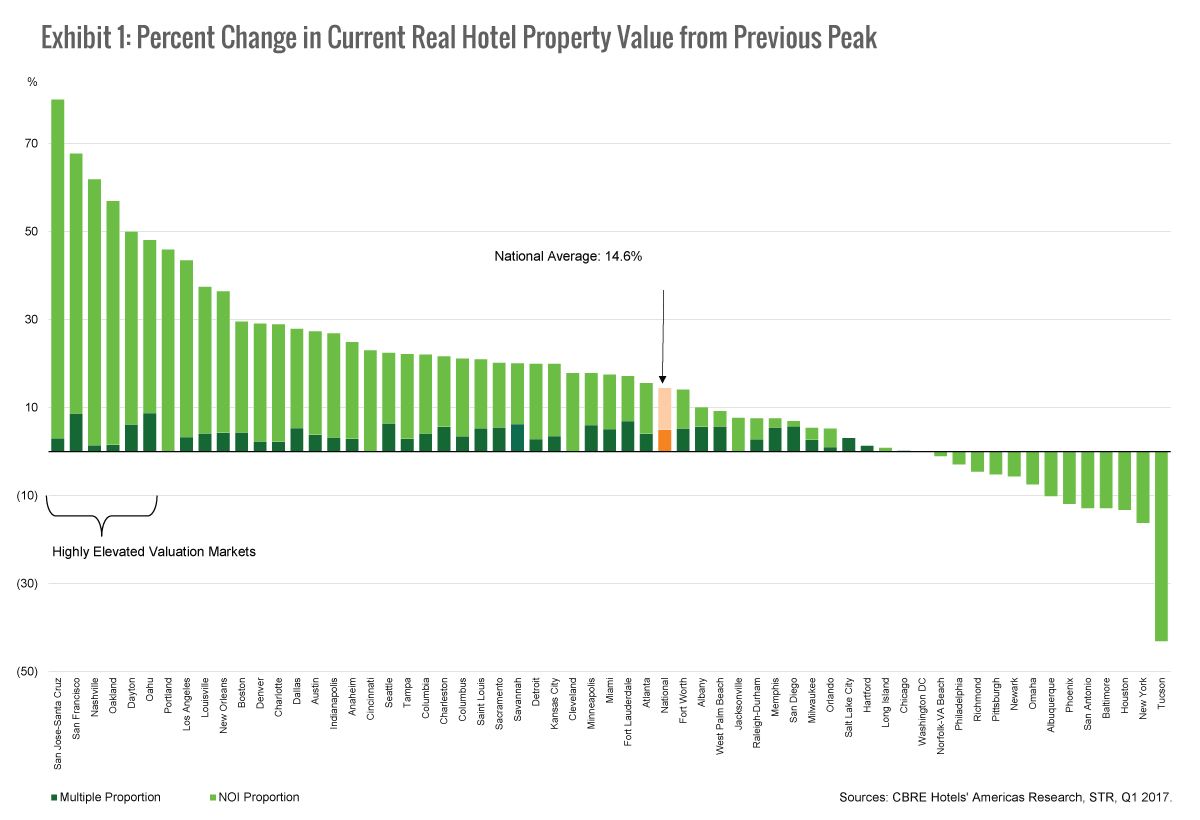
Exhibit 1 presents the results of an analysis whereby the value of a typical hotel in each market during Q4 2016 is compared with its corresponding value at the previous market peak—in other words, the quarter of previous peaks differ somewhat by market. Unique indexes are produced for each market. The height of the bars shows how much in percentages that the value indexes changed in real terms during the current recovery and expansion period.
Here is the complication: Values are not prices! A price is an observable fact and a value is an estimate from a model designed to predict what a price should be. The two components of values (V) presented in Exhibit 1 are NOI and capitalization rate, where V = 1/R (NOI). If the values mostly come from NOI expansion, then they have a decidedly fundamental origin. If multiple expansion is the main determinant of value, then the pricing (normal or extraordinary) of incomes takes center stage.
To this point, the bars in Exhibit 1 are split into two parts such that the darker segment represents multiple expansion and the lighter segment shows the NOI growth contribution. The height of the bars does not portend a hotel price bubble, but instead shows which markets are prone to the largest busts should local conditions suddenly change.
 (CLICK TO ENLARGE.)
Note: For each year in each city, the NOI is estimated from samples of actual property performance in the CBRE Hotels' Americas Research Trends data base is divided by the capitalization rate for each year in each city using RERC and RCA data to obtain value estimates. Previous value peaks were determined and percentage changes from these city-specific peaks relative to 2016 values are computed. Capitalization rate multiples and NOI growth rates are determined by simple proportional allocations.
Hotel property values in the U.S. during Q4 2016 stood at 14.6% above the previous peak, yet several city markets shown on the right side of Exhibit 1 did not achieve levels that exceed previous peaks. The threats of bubble collapses and their consequences in most of the top 60 markets do not appear imminent from this evidence.
However, eight markets—San Jose/Santa Cruz, California; San Francisco; Nashville, Tennessee; Oakland, California; Dayton, Ohio; Oahu, Hawaii; Portland, Oregon; and Los Angeles—experienced hotel value increases 40% greater than their previous peaks. In another half-dozen or so markets, value increases approached 30%. Markets in the western U.S. dominate the most quickly growing group. Notwithstanding, the contribution from NOI growth far outweighs the contribution from multiple expansion in all of the markets in which value growth exceeds 25%. These data points indicate that the largest local value increases have a fundamental reason to exist!
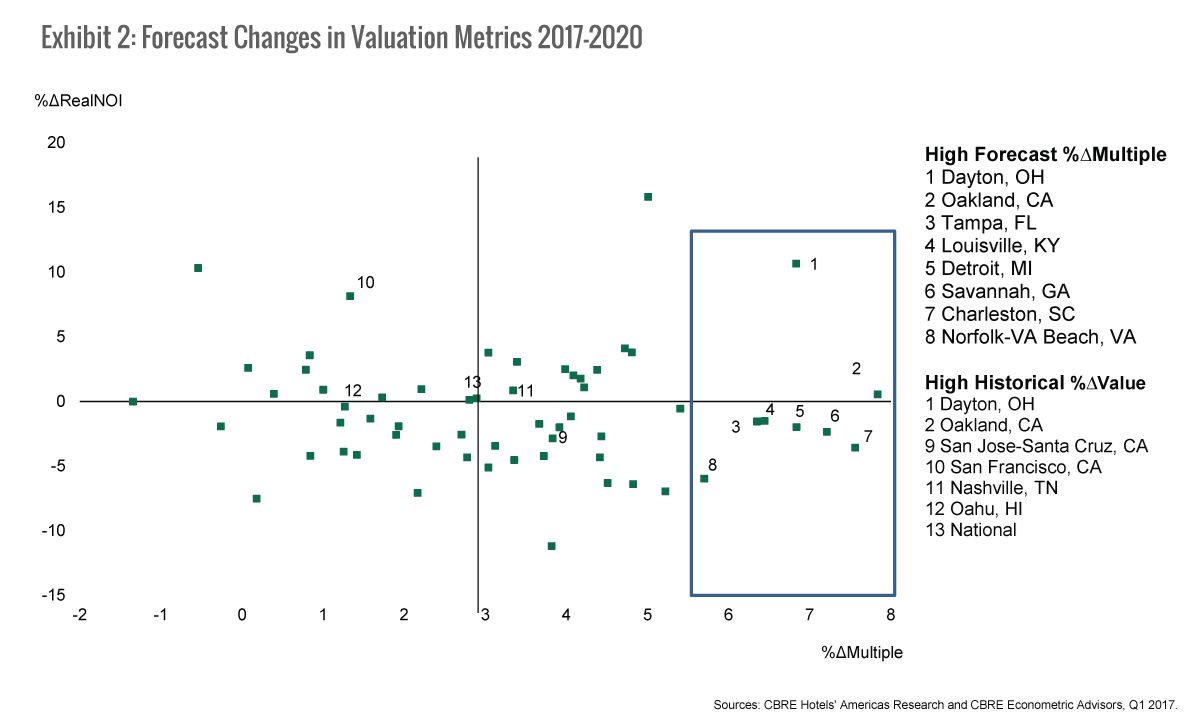
Exhibit 1 presents what happened to property values in U.S. hotel markets in the past. Exhibit 2 shows what CBRE Hotels' predicts will happen to the components that generate value changes, although the actual value changes across the cities are not presented. This scatterplot comes from intersecting the forecast NOI multiple from 2017 through 2020 on the x-axis and the real NOI growth rate for the same future period on the y-axis. If hotel property values are expected to increase more because of real NOI growth, then investors may find more comfort than if multiple expansion is expected to be the engine of value appreciation.
The forecast for the U.S., indicated as 13 on the chart, is comprised of approximately 3% multiple expansion and negligible real NOI growth.
The markets positioned the farthest out to the right shown in the boxed area are those expected to realize value growth most dependent on multiple expansion. Dayton (1) is forecast to experience value increases based on strong positive changes in its multiples, but also value growth comes from relatively high growth rates in NOI. For Oakland (2), Charleston, South Carolina (7), and Norfolk-Virginia Beach (6), future multiple expansion is among the highest of the major hotel markets in the U.S. and is expected to dominate in contributing to value increases. Hot city markets in California and locations such as Nashville and Oahu that demonstrated large percentage increases in hotel values from the historical pricing perspective are not represented (except Oakland) in the boxed area of Exhibit 2.
 (CLICK TO ENLARGE.)
Note: For each future year 2017-2020 in each city, forecasts of NOI are developed using historical data from actual properties in the CBRE Hotels' Americas Research Trends database and a set of econometric equations created to predict other revenues and various expenses from room revenue. Room revenue forecasts come from CBRE Hotels' Hotel Horizons forecasting platform. To obtain value estimates, these future NOIs are divided by forecasts of capitalization rates for each year in each city using RERC and RCA data and an econometric model of capitalization rates specified with Gordon Growth model components. Future values for model components come from forecasts of capital market rates produced by CBRE's Econometric Advisors and the foregoing NOI forecasting activity (NOI growth rates). Future values are proportionally allocated to real NOI growth and capitalization rate multiple expansion, then plotted.
Conclusion
Readers always draw their own conclusions from results such as these.
My take is the national and city hotel markets by the end of 2016 did not begin floating from an infusion of non-fundamental helium. During the next four years, a handful of markets are forecast to have the hotel property value growth characteristics to justify being on the bubble watch list.
References
- Bourassa, S. C., M. Hoesli, and E. Oikarinen, (2016). Measuring House Price Bubbles. Swiss Finance Institute, Research Paper Series No. 16-01.
- Glasser, E. L. and C. Nathanson (2014). Housing Bubbles. NBRE Working Paper No. w20426.
- Jorda, O. M. Schularick, and A. M. Taylor (2016). Bubbles, Credit, and Their Consequences. FRBSF Economic Letters 2016-27 (September).
- Levitan, A. J. and S. M. Wachter (2013). The Commercial Real Estate Bubble. Harvard Business Law Review 3, 83-118.
- Mayer, C. J. (2011). Housing Bubbles: A Survey. Annual Review of Economics 3, 559-577.
Acknowledgement
- Bram Gallagher, Ph. D., Economist with CBRE Hotels' Americas Research, provided invaluable assistance in the preparation of this report.
- Jack Corgel, Ph. D., is Managing Director of CBRE Hotels' Americas Research and Professor of Real Estate at the Cornell University School of Hotel Administration.
- The assertions expressed in this article do not necessarily reflect the opinions of Hotel News Now or its parent company, STR and its affiliated companies. Please feel free to comment or contact an editor with any questions or concerns.