The top hotel markets in this edition of STR’s U.S. “bubble” chart update show the persistent staying power of warm, outdoor-oriented markets as well as expected seasonal shifts for the opening months of the year.
Additionally, for the four weeks ending 11 February, the greatest driver of gains in revenue per available room (RevPAR) continued to be average daily rate (ADR), while occupancy remained below 2019 benchmarks for more than half of markets. A handful of Top 25 Markets continued to outpace their key historical metrics, but various large markets remain persistently slow in closing the gap on their pre-COVID indicators.
Among Top 25 Markets, Tampa was the only destination with a higher occupancy than the matching four weeks of 2019. Outside of the Top 25 Markets, about half of the remaining areas (70 of 142) had four-week average occupancy exceeding their 2019 comp. In the medium term, a minority of largely rural and non-metropolitan markets (28 total or 17% of all markets) experienced year-over-year occupancy declines. This may be indicative of slowing rural travel. ADRs, in contrast, have nominally increased from 2019 levels for 93% of markets. Markedly, four of the 11 market ADR decliners from 2019 fall within in the Top 25 Markets.
Overall positive expectations in markets’ ADR/RevPAR indicators should be counterbalanced with an understanding of the unfavorable relationship between inflation and hoteliers’ overall performance. Inflation, as measured by the consumer price index, was 6.4% over the past 12 months and 18.4% when compared to the same period from 2019. This raises the bar high for hoteliers, especially when pricing rooms during uncertain economic times.
When adjusting for inflation, only 62 markets (37%) recently achieved real ADRs at/or above 2019 levels. Despite the traditionally slower travel season, the industry has demonstrated resiliency with real RevPAR in 46% of markets (77 of 167) matching or exceeding the 2019 period comp.

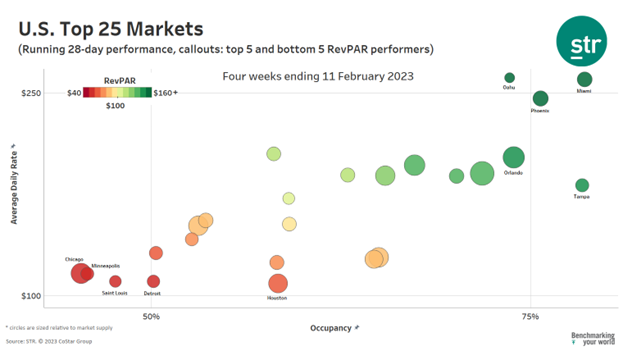
Miami led the Top 25 Markets with a four-week average RevPAR of $204, followed by Oahu ($192), Phoenix ($186, which included the pre-Superbowl week), Orlando ($149) and Tampa ($143). Coming out of the winter holidays, Oahu’s last four weeks’ average RevPAR dropped $72 (-27%). Given the impact of the Super Bowl lead-in period, Phoenix’s RevPAR soared $91 (+96%) from the prior month, as its ADR increased $86 MoM to $246.
Nominal (non-inflation adjusted) RevPAR increased in four of the five market leaders when compared to matched weeks in 2019, with only Oahu lagging 2019’s RevPAR. As alluded to earlier, a dollar earned today does not go as far as 2019 and, after accounting for inflation, only Phoenix with an indexed RevPAR value of 123 (or 23% above 2019) and Tampa (115) averaged RevPAR higher than 2019. Orlando (96), Miami (95) and Oahu (83) rounded out the other top market indices.
As a reminder, the last U.S. forecast revision from STR and Tourism Economics called for top-line and profitability gains to slow as inflation outgrew pricing.
Among bottom RevPAR markets, three (St. Louis, Chicago, and Minneapolis) tied with an average RevPAR of $53 (indices of 94, 83, 76, respectively). This was followed by Detroit ($55, 73 index) and Houston ($64, 86). Houston, which has been substantially slower in recuperating its room rates, clearly sits to the right of other laggard markets by achieving higher period occupancies (58.4%) while charging the lowest average daily rates ($109).
In terms of monthly occupancy change, Phoenix experienced the largest monthly surge in occupancy, gaining 16.4 percentage points to 75.7%. Likewise, Tampa experienced a similar scale gain of 14 ppts to 78.4% occupancy.
In the starting weeks of 2023, the largest U.S. markets still largely remained behind 2019 performance both in demand and occupancy. Despite being a RevPAR leader, Oahu’s demand was down 14%. San Francisco’s recent demand was down 25% from 2019.
On the low end of the performance scale, Chicago’s room demand was down 8% from 2019, and demand in Minneapolis was off by 10%. Only seven of the Top 25 Markets’ recent four-week total room demand surpassed the matched period from 2019, including Miami (+6%) and Tampa (+11%).
Supply gains can further offset occupancy. In the case of Tampa, its three-year 11% increase in supply has more than offset its demand increases resulting in a net occupancy decrease in the market.
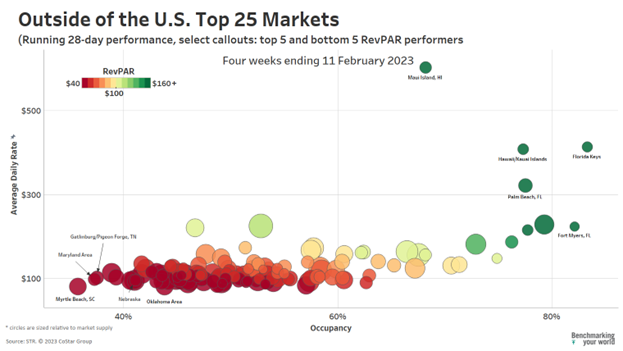
Outside of the largest markets, sunny, warm, high-end beach destinations continue to demonstrate their dominance thus far into 2023. The top, non-large markets for the previous four weeks were led in RevPAR by Maui ($411), Florida Keys ($344), Hawaii/Kauai Island ($315), Palm Beach ($248) and Fort Myers ($184). Maui’s $603 ADR towered over other U.S. markets and was nominally 50% higher than the period of 2019 despite recent market occupancy (68.2%) running significantly lower than 2019 (78.7%). This was followed by the Florida Keys’ $413 ADR (a 47% gain from 2019) and Hawaii Island at $408 (+36% from 2019).
An added observation for this period is how Fort Myers notched market occupancy of 82.2%, which was below its 83.9% from last year. With certain areas of the market being lost to Hurricane Ian in October, a decrease of roughly 30% of room supply seems to have mostly negated a recent 25% drop in room market demand compared to the same time last year.
If you are interested in accessing the data behind these visuals via our hospitality platform in CoStar, please contact us at [email protected].