
By Jeremy Teo , Ho Mei Leng , Hok Yean CHEE
Transactions in Asia Pacific
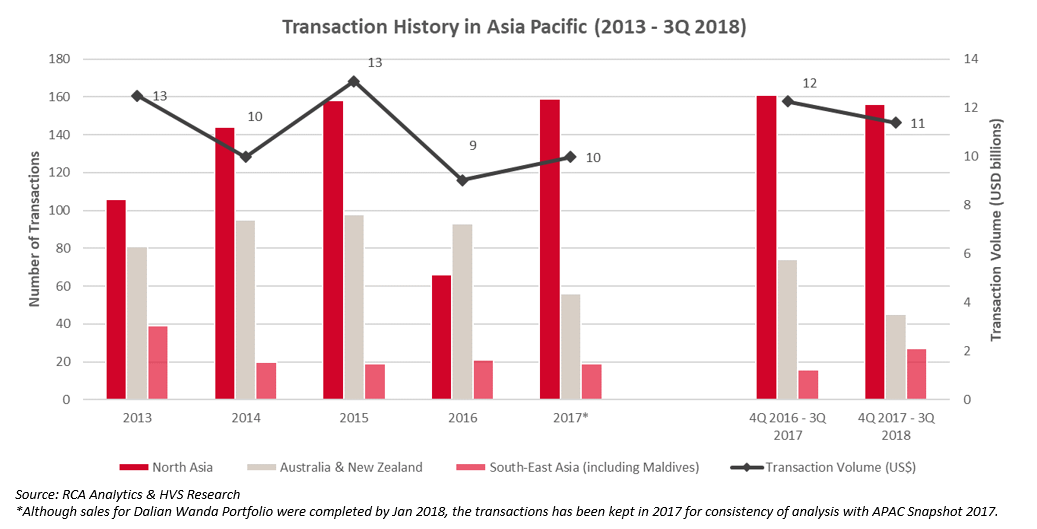
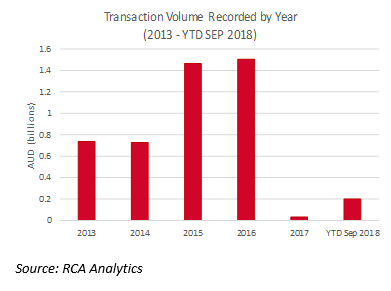
Transaction activity has been observed to be on a downward trend from 2013 until 2017, owing to the transactions of Dalian Wanda China portfolio to R&F Properties. Since then, the frequency of transactions have been high, with 228 recorded transactions from 4Q2017 to 3Q2018, slightly lower than the 251 recorded the previous four quarters.
Geographically, the pick up in transaction activity can be attributed to the North Asia and South-East Asia markets, while Australia markets witnessed a slowdown. Reasons for the increase in transaction activity could plausibly be attributed to the increase in investment opportunities, potential for growth in developing markets, buyers willingness to meet seller’s demands, amongst others.
Frequency and Volume of Hotel Transaction Volume
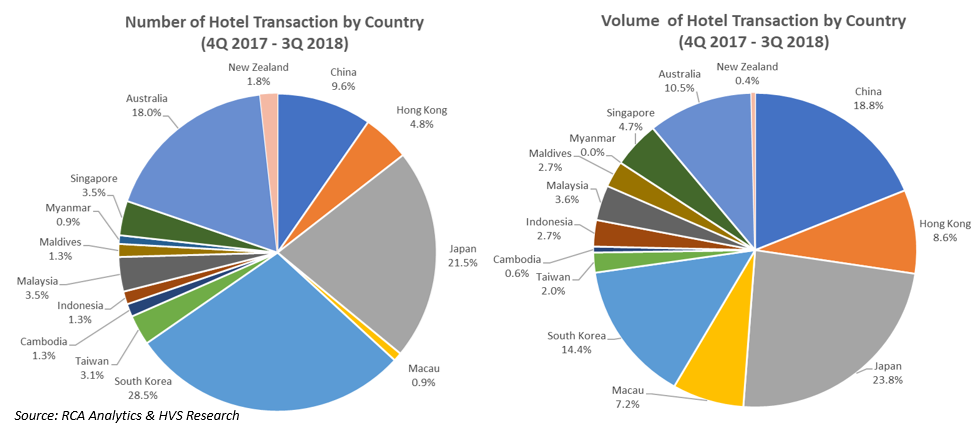
Over the period from 4Q2017 to 3Q2018, South Korea leads in number of hotel transactions with 65 transacted properties, 45 more than the previous four quarters. The increase comes despite weakening hotel market performance, indicating that investors’ sentiment in the market remains optimistic. Markets across South-East Asia (including Maldives) recorded 27 transactions from 4Q2017 to 3Q2018, almost double the 16 recorded in the previous four quarters. With the exception of Philippines and Vietnam, all South-East Asia markets recorded more transactions in the last four quarters.

Key Points
- Tourism directly contributes 3.0% to GDP in 2017
- 2.9% Real GDP growth expected in 2018
- 8.6 million international tourist arrivals recorded in 2017
Highlights
Infrastructure Projects
- A$3.5 billion redevelopment of Melbourne Airport, by 2023
- A$6-8 billion construction of Sydney West Airport by 2026
New Hotel Openings in Sydney and Melbourne
2018 (Top Three Largest Inventory) • Mantra Melbourne Shadow Play, 300 keys • NEXT Hotel Melbourne, 300 keys • Ibis Melbourne Little Lonsdale, 270 keys
2019-2021 • Luxury: 5 Hotels, 1,540 keys • Upper Upscale: 9 Hotels, 1,533 keys • Upscale: 19 Hotels, 1,694 keys • Upper Midscale: 5 Hotels, 1,076 keys • Midscale: 2 Hotels, 371 keys • Economy: 1 Hotel, 97 keys • Independent: 9 Hotels, 1,901 keys
Notable Transactions
• 122-key Park Regis City Centre transacted at A$54.2 million (A$444,098/key) in September 2018 • A 241-key hotel on Flinders Land, to be branded as a Quincy Hotel, transacted at A$91.2 million (A$378,423/key) in August 2018
Demand
In the first seven months of 2018, tourist arrivals displayed positive year-on-year (y-o-y) growth of 6.1%. China, which overtook New Zealand as the top source market, has a 17.3% market share as of year-to-date (YTD) July 2018. Over the same period, arrivals from China recorded an 8.2% y-o-y growth, significantly higher than the 1.8% y-o-y growth for arrivals from New Zealand. Domestic visitors continue to play a major role as they account for 57% of visitors in 2017.
Supply
HVS has noted that, going forward, there will be 137 additional hotels with approximately 22,981 keys in Australia by 2021, having 43 hotels opened in the first three quarters of 2018.

Sydney and Melbourne Hotel Performance 2017 vs. 2018F
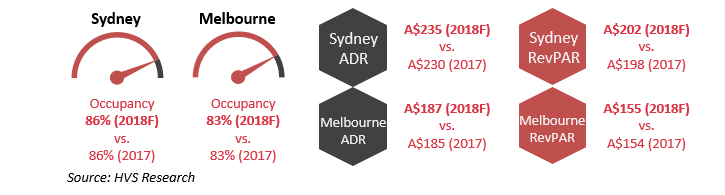
As of YTD July 2018, hotel occupancy in Sydney decreased by 1.6 percentage points (p.p.), while occupancy in Melbourne increased by a marginal 0.9 p.p. Sydney’s room rates increased slightly by 0.2% y-o-y, while Melbourne’s room rates increased by 0.7%.
Transactions
 Although total volume of investment activity across both cities had been increasing y-o-y from 2013 to 2016, investment activity has fallen since 2017. In 2017, only two transactions were recorded in Melbourne CBD. In 2018, Sydney CBD and Melbourne CBD recorded three and one transactions respectively.

Key Points
- Tourism directly contributes 14.1% to GDP in 2017
- 7.2% Real GDP growth expected in 2018
- 5.6 million international tourist arrivals recorded in 2017
Highlights
Infrastructure Projects
• New terminal opened at Sihanoukville International Airport, with plans to extend runway by 800 meters to welcome larger international aircrafts • Construction of 190 kilometres expressway linking Phnom Penh and Sihanoukville from November 2018
New Hotel Openings in Cambodia
2018 • Treeline Urban Resort, 48 keys
2019-2021 • Luxury: 3 Hotels, 685 keys • Upscale: 2 Hotels, 268 keys • Midscale: 4 Hotels, 913 keys • Economy: 2 Hotels, 488 keys
Notable Transactions
• 170-keys Raffles Le Royal Phnom Penh transacted at US$33.4 million (US$197,000/key) in June 2018 • 125-keys Raffles Grand Hotel Siem Reap transacted at US$24.6 million (US$ 197,000/key) in June 2018
Demand
In 2017, tourist arrivals displayed significant y-o-y growth compared to the previous year, with an increase of 12% in tourist arrivals. The largest source market was the Chinese market, making up a total of 22% of tourist arrivals, with a growth of 46% compared to 2016. Despite being the second largest source market, Vietnamese tourist arrivals declined by 13% as a result of actions taken against Vietnamese tour operators in Cambodia. In 2017, both Phnom Penh and Siem Reap experienced significant growth in tourist arrivals with 3.1 million (from 2.8 million) and 2.4 million (from 2.2 million) tourist visiting Phnom Penh and Siem Reap respectively.
Supply

HVS has noted that, going forward, there will be 12 additional hotels with approximately 2,170 keys in Cambodia by 2021. The continued growth of international brands with the recent opening of the Rosewood Phnom Penh and the Courtyard by Marriott Siem Reap will further increase tourism awareness and attractiveness of the destination.
Phnom Penh and Siem Reap Hotel Performance 2017 vs. 2018F
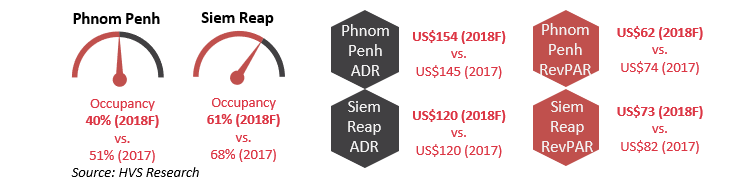
Based on our analysis of a few branded and independent hotels in Phnom Penh and Siem Reap, we have estimated in 2017 an average occupancy of 51% and 68%, with an ADR of US$146 and US$122, respectively. The forecasted reduction in occupancy in 2018 accounts for new supply entering the market including the 233-key Courtyard by Marriott Siem Reap, and the NagaWorld 2 Phnom Penh. However, with continued growth in tourist arrivals and improvements in accessibility we expect an overall increase in hotel performances in the future.
Transactions
There have been limited transactions in Cambodia, with only six transactions recorded in the last five years. According to the Council for the Development of Cambodia (CDC), foreign direct investment (FDI) in Cambodia has almost double from US$3.6 billion in 2016 to US$ 6.3 billion in 2017. China has maintained its position as the largest investors for the last five years. Going forward, the CDC expects investment from China will continue to increase over various sectors including infrastructure. Furthermore, the continued improvement in infrastructural developments will further entice foreign investment.
Key Points
- Tourism directly contributes 11% to GDP in 2017
- 6.5% Real GDP growth expected in 2018
- 139.5 million inbound tourist arrivals recorded in 2017
Highlights
Infrastructure Projects
• Daxing Airport, the second airport in Beijing, is set to open in October 2019 • Expansion of Shanghai Pudong International Airport by 2020 to bust capacity to 80 million • The development of nationwide high-speed train network
New Hotel Openings in Beijing and Shanghai
2018 • Luxury: 8 Hotels, 1,435 keys • Upper Upscale: 8 Hotels, 1,968 keys • Upscale: 10 Hotels, 2,526 keys • Upper Midscale: 16 Hotels, 2,348 keys 2019-2021 • Luxury: 5 Hotels, 1,500 keys • Upper Upscale: 19 Hotels, 5,121 keys • Upscale: 12 Hotels, 3,199 keys • Upper Midscale: 13 Hotel, 2,056keys
Notable Transactions
• Portfolio of 75 hotels under Dalian Wanda sold at RMB19 billion in 2017 • 349-key W Beijing Chang’an sold for RMB1.98 billion in December 2017
Demand
In the first half of 2018, inbound tourist arrivals displayed negative y-o-y growth. YTD June 2018 arrivals of 69.2 million is slightly lower than last year by 0.4%, mainly due to the decrease of Hong Kong visitors by 2.7%. Arrivals from Hong Kong, Macau and Taiwan account for 78.6% of the total inbound arrivals. Since 2017, Myanmar overtook South Korean as the top source market for international visitors, followed by Vietnam, South Korean, Japan and United States. HVS noted that a growing number of visitation from the “One Belt One Road” countries is observed in China’s inbound tourism market. Domestic visitors continue to play a major role as they account for 97.6% of the total visitor arrivals with 11.4% y-o-y growth.
Supply

HVS has noted that, going forward, there will be more than 670 additional hotels with approximately 150,000 keys in China by 2021.
Beijing and Shanghai Hotel Performance 2017 vs. 2018F
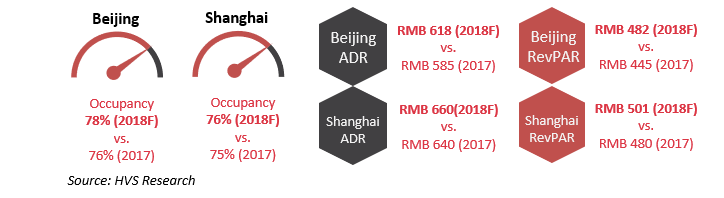
As of YTD July 2018, Beijing hotel market recorded a y-o-y increase in occupancy of approximately 3%, while Shanghai’s occupancy recorded a decline of 3%. The room rates of both cities are observed to increase in 2018.
Transactions
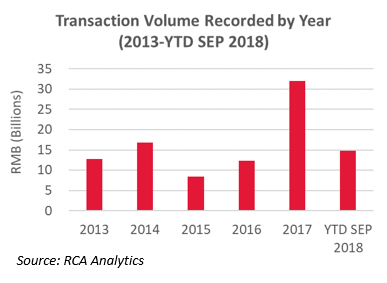 Hotel transaction volume reached its highest-ever figure of approximately RMB32 billion in 2017, as a result of the portfolio of 75 hotels under Dalian Wanda Group being sold for approximately RMB19 billion. Investment activities remains active in 2018, with 17 transactions being recorded as of YTD SEP 2018, reaching approximately RMB14.8 billion.
Key Points
- Tourism directly contributes 16.7% to GDP in 2017
- 3.4% Real GDP growth expected in 2018
- 58.4 million international tourist arrivals recorded in 2017
Highlights
Infrastructure Projects
• Guangzhou-Shenzhen-Hong Kong Express Rail Link to be in operations in 2018 • Hong Kong International Airport Master Plan 2030 for third runway
New Hotel Openings in Hong Kong
2018 • Ocean Park Marriott Hotel, 472 keys • Rosewood Hong Kong, 413 keys 2019 • FourPoints by Sheraton Hong Kong Tung Chung, 1,006 keys • Holiday Inn Express Hong Kong Kowloon CBD 2,286 Keys • Sheraton Hong Kong Tung Chung, 228 keys • MGallery Hotel Citygate Hotel Hong Kong, 200 keys 2020 • St. Regis Hong Kong, 129 keys • Regal Hong Kong, 1,208 keys
Notable Transactions
• 503-key InterContinental Hong Kong was transacted at HKD7.7 billion (HKD15m/key) in June 2017
Demand
In the year of 2017, the city’s tourism recovery is reflected in the 3.2% y-o-y increase in visitor arrivals to over 58.4 million, an additional 1.8 million over 2016. China accounts for more than 75% of the visitor arrivals, followed by Taiwan, South Korea, United States, and Japan at market shares of 3.4%, 2.5%, 2.1%, and 2.1% respectively. North Asia market’s robust growth of visitor arrivals is highly driven by the increasing popularity, along with the rising number of budget flights from South Korea and Japan. Strengthened by a 10.1% y-o-y growth in the first half of 2018, Hong Kong is back on track with tourism and economic prosperity.
Supply

Moving forward, Hong Kong hotel supply is expected to increase from approximately 80,000 rooms in June 2018 to 90,000 rooms by 2021.
Hong Kong Hotel Performance 2017 vs. 2018F
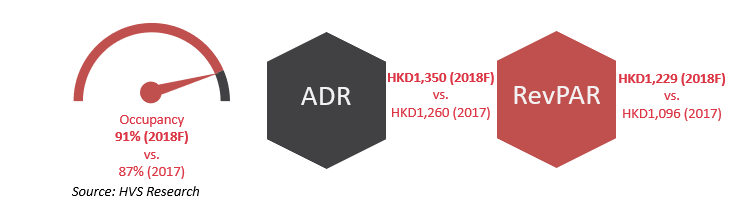
As of YTD June 2018, hotel occupancy in Hong Kong recorded a strong growth of 3.5 percentage points. Similarly, Hong Kong’s room rates increased significantly by 7.7% y-o-y.
Transactions
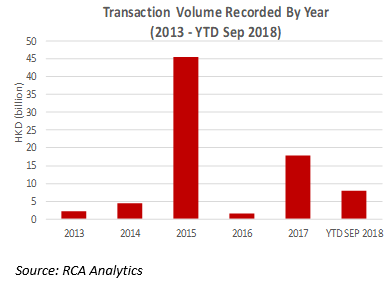 The total volume of investment activity in Hong Kong experienced noticeable spikes during the 2015 ADIA-New World deal and the 2017 InterContinental deal. These two deals overshadowed the active market in 2018 with HKD7 billion of transactions, approximately HKD78 million per key.

Key Points
- Tourism directly contributes 1.9% to GDP in 2017
- 5.2% Real GDP growth expected in 2018
- 14.0 million international tourist arrivals recorded in 2017
Highlights
Infrastructure Projects
• Infrastructure development budget of Rp411 trillion allocated in 2018, 5.8% increase over 2017 • Plans to develop ten new airports to support tourism
New Hotel Openings in Bali and Jakarta
2018 (Top Three Largest Inventory) • Swiss-Belhotel Kelapa Gading, 316 keys • Harris Resort Benoa Bali, 280 keys • Harris Hotel Hayam Wuruk Jakarta, 265 keys 2019-2021 • Luxury: 15 Hotels, 3,248 keys • Upper Upscale: 7 Hotels, 1,651 keys • Upscale: 16 Hotels, 3,405 keys • Upper Midscale: 10 Hotels, 2,647 keys • Midscale: 12 Hotels, 1,915 keys • Economy: 2 Hotels, 231 keys • Independent: 5 Hotels, 955 keys
Notable Transactions
• Bintan’s first transaction in last five years: 470-key Bintan Lagoon Resort was sold for Rp1.3 trillion (Rp2.8bn/key) to ABR Holdings
Demand
In the first half of 2018, tourist arrivals continued its strong y-o-y growth with 7.5 million arrivals, outstripping the previous year’s arrivals by 13%. Over the same period, Malaysia overtook China for the leading source market with a significant 30% y-o-y growth, achieving 1.3 million arrivals. China remains strong in second with arrivals relatively stable at 1.0 million arrivals. While Singapore and Australia remains the third and fourth source market, India overtook Japan for the fifth spot.
Supply

HVS has noted that, going forward, there will be 225 additional hotels with approximately 42,000 keys in Indonesia by 2021, having 29 hotels opened in the first three quarters of 2018.
Jakarta and Bali Hotel Performance 2017 vs. 2018F
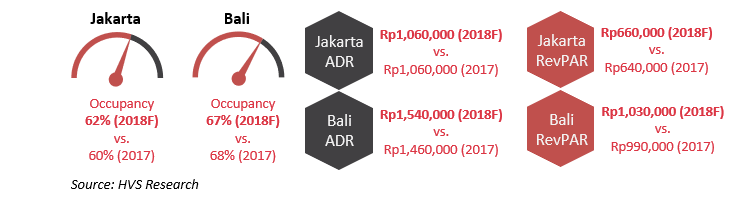
A different trend is observed this year with Bali recording a drop of 1.0% in occupancy as of YTD July 2018, while Jakarta’s occupancy increased by 3.8% over the same period. Bali, buoyed by the entrance of new products, saw room rates increased by 5.4% while room rates in Jakarta remained stable.
Transactions
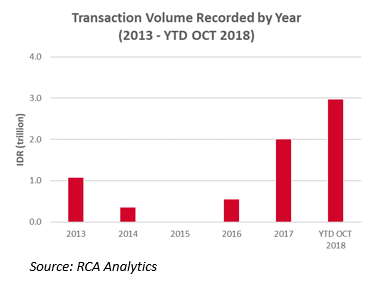 Over the period from 2013 to YTD October 2018, transaction activities in Indonesia bottomed in 2015 when there was no recorded transactions. Since then, the frequency of transactions has been increasing and within the first ten months of 2018, two properties have changed hands, maintaining pace with 2017. However, total transaction volume of Rp2,981 billion represents a 48% increase in transaction volume than in 2017.
Key Points
- Tourism directly contributes 2.2% to GDP in 2017
- 1.3% Real GDP growth expected in 2018
- 28.7 million international tourist arrivals recorded in 2017
Highlights
Infrastructure Projects
• First phase of the Maglev line by 2027 • ¥160 billion expansion of Narita International Airport by 2020 • Expansion of Haneda International Airport by 2020
New Hotel Openings in Tokyo & Osaka
2018 (Top Three Largest Inventory) • Hotel Keihan Tsukiji Ginza Grande, 297 keys • Sotetsu Fresa Inn Osaka Shinsaibashi, 176 keys • Gate Hotel Tokyo, 164 keys
2019-2021 • Luxury: 5 Hotels, 1,043 keys • Upper Upscale: 2 Hotels, 693 keys • Upscale: 22 Hotels, 9,052 keys • Upper Midscale: 12 Hotels, 3,272 keys • Midscale: 5 Hotels, 1,163 keys • Independent: 34 Hotels, 9,596 keys
Notable Transactions
• 1016-key Sheraton Grande Tokyo Bay sold for ¥100 billion (¥98m/key) in Oct 2017
Demand
Tourist arrivals continued its momentum from 2017 into the first half of 2018, with a 15.6% y-o-y growth, recording 15.9 million. China maintained in pole position as the leading source market making up 26% of total arrivals as of YTD June 2018, with an increase of 774,832 arrivals. Korea remain in close second, representing 25% of total arrivals with 4 million visitors. Domestic passengers accounted for 42% of all passenger movements, down from 45% the previous year, across all four airports in Tokyo and Osaka, as international arrivals increased at a faster pace.
Supply

HVS has noted that, going forward, there will be 190 additional hotels with approximately 45,700 keys in Japan by 2021, having 98 hotels opened in the first three quarters of 2018.
Tokyo and Osaka Hotel Performance 2017 vs. 2018F
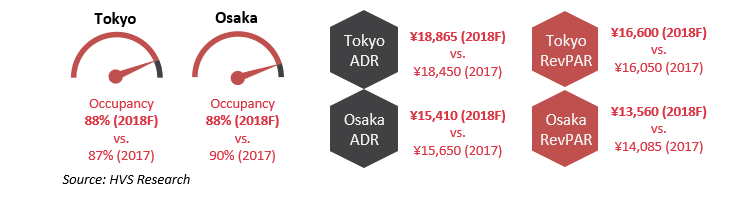
As of YTD July 2018, while occupancy of Tokyo hotel market recorded a y-o-y increase of 1.6 p.p., Osaka hotel market recorded a y-o-y decrease of 1.8 p.p. Tokyo’s room rates remain strong with 2.7% y-o-y growth, while the downward momentum on rates continued in Osaka.
Transactions
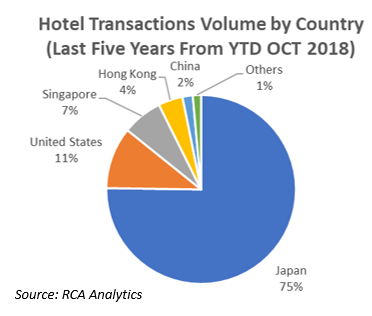
Investment activities have been active within the first ten months of 2018, with 36 recorded transactions, 50% more than that over the same period in 2017. Over the last five years from YTD October 2018, Japanese companies continue to play an integral role, contributing to a majority of transaction volume. Despite lower transaction volume, Singapore based investors accounted for a higher number of transactions than United States based investors.
Key Points
- Tourism directly contributes 4.8% to GDP in 2017
- 5.7% Real GDP growth expected in 2018
- 25.9 million international tourist arrivals recorded in 2017
Infrastructure Projects
• RM29 billion Pan Borneo Highway by 2021 • RM32-40 billion construction of Mass Rapid Transit Line 2 by 2022
New Hotel Openings in Kuala Lumpur and Langkawi
2018 (Top Three Largest Inventory) • Holiday Inn & Suites Cyberjaya, 410 keys • Banyan Tree Royale Pavilion Hotel, 323 keys • Hyatt House Kuala Lumpur, 298 keys
2019-2021 • Luxury: 4 Hotels, 1,088 keys • Upper Upscale: 1 Hotel, 478 keys • Upscale: 5 Hotels, 1,330 keys • Upper Midscale: 4 Hotels, 836 keys • Midscale: 3 Hotels, 589 keys
Notable Transactions
• 420-key Hilton Garden Inn Kuala Lumpur sold for RM240 million (RM571k/key) in July 2018
Demand
In 2017, tourist arrivals in Malaysia decreased by 3% since the vast improvement seen in 2016. The downward trend continue into 2018 which recorded a 3.4% decrease in YTD April arrivals. Singapore (46.5%) and Indonesia (10.5%) remains the top two source markets, despite the decline in 2017 arrivals of 6.3% and 10.3% y-o-y respectively. Arrivals from Brunei exhibit the most significant growth of 19.4% y-o-y.
Supply

HVS has noted that, going forward, there will be 77 additional hotels with approximately 19,800 keys in Malaysia by 2021, having 11 hotels opened in the first three quarters of 2018.
Kuala Lumpur and Langkawi Hotel Performance 2017 vs. 2018F
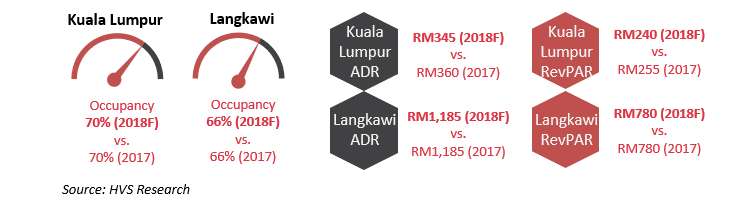
As of YTD July 2018, Kuala Lumpur recorded a y-o-y increase in occupancy of approximately 1.3 p.p. However, Kuala Lumpur’s room rates fell by 1.6%. Based on HVS estimates, occupancy in Langkawi is forecasted to remain at 66% in 2018. Despite limited new supply, HVS forecasts that room rates in Langkawi is expected to remain unchanged due to subdued demand.
Transactions
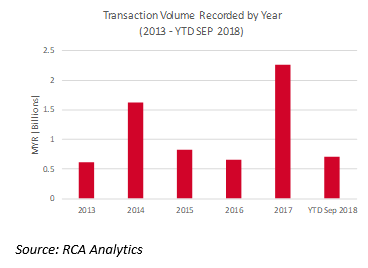 Malaysia’s hotel transactions reached approximately RM0.7 billion as of YTD September 2018, a slow down from 2017’s high volume of transactions. The high volume in 2017 was reflective of positive sentiment in the hotel market across the country as tourism recovered from its lacklustre performance in 2015 and 2016. Over the last five years, Kuala Lumpur accounted for 20 of the 47 recorded transactions.

Key Points
- Tourism directly contributes 39.6% to GDP in 2017
- 4.7% Real GDP growth expected in 2018
- 1.39 million international tourist arrivals recorded in 2017
Highlights
Infrastructure Projects
• Opening of Funadhoo Airport (MVR 60 million), Maafaru Airport (US$ 60 million), Kulhudhuffushi Airport (US$ 11.4 million) in H2 2018 • Recent expansion of Velana International airport • Recent opening of Sinamalé inter-island bridge connecting Malé and Hulhulé for the total cost of US$ 200 million
New Resort Openings in Maldives
2018 • RIU Classic Maldives, 248 keys • RIU Palace Maldives, 174 keys • Carpe Diem Beach Resort & Spa, 115 keys 2019-2021 • Luxury: 6 Resorts, 544 keys • Upper Upscale: 6 Resorts, 1,324 keys • Upscale: 2 Resorts, 300 keys • Independent: 2 Resorts, 261 keys
Notable Transactions
• 45-key Cheval Blanc Randheli transacted at US$215 million (US$4,781k/key) in December 2017
Demand
In the first half of 2018, tourist arrivals displayed a positive y-o-y growth. YTD August 2018 arrivals of 973,000 outstripped last year’s arrivals by 9%. China remains a key source market despite the decline in Chinese visitors by 5.5% in 2017. We note that recently, Italy, Russia and France have emerged as fast growing source markets for the Maldives with a y-o-y increase of approximately 20%.
Supply

HVS has noted that, going forward, there will be 20 additional establishments with approximately 3,000 keys in Maldives by 2021, having three resorts opened in the first three quarters of 2018.
Maldives Resort Performance 2017 vs. 2018F
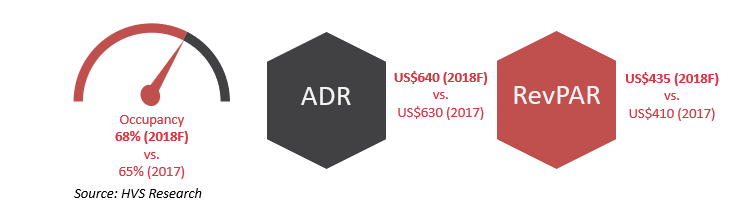
As of YTD July 2018, Maldives recorded an increase of 2.5% p.p. in occupancy and an increase of 1.3% in ADR y-o-y, with an average occupancy of 67% and an ADR of US$640.
Transactions
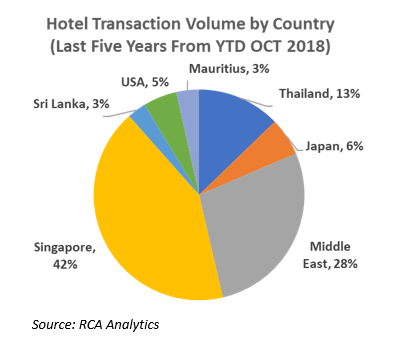
Over the last five years, investments in Maldives have mainly been made by Singapore-based investors. However, in December 2017, a buyer from Middle East acquired the 45-key Cheval Blanc Randheli for the price of US$215 million. This transaction account for 28% of total hotel transaction volume over the last five years. Two others transactions with a value per key of US$430,000 and US$990,000 were recorded in 2017 and 2018 respectively.

Key Points
- Tourism directly contributes 2.7% to GDP in 2017
- 6.9% Real GDP growth expected in 2018
- 3.44 million international tourist arrivals achieved in 2017
Highlights
Infrastructure Projects
• Opening of the Hanthawaddy International Airport, with an initial annual capacity of 12 million, by 2022
New Hotel Openings in Yangon
2018 • Rosewood Yangon, 209 keys
2019-2021 • Upper Upscale: 4 Hotels, 1,188 keys • Upscale: 1 Hotel, 200 keys • Upper Midscale: 2 Hotels, 653 keys
Notable Transactions
• 72-key Hotel Suggati located in Mawlamyine was transacted at US$ 352k (US$ 4,900/key) in July 2018
Demand
In 2017, tourist arrivals displayed positive y-o-y growth. Arrivals of 3.44 million was significantly higher than 2016’s arrivals by 18%. Neighbouring Thailand is Myanmar’s top source market, making up 20% of total tourist arrivals, followed closely by China at 16%. We note that recently, Singapore is a key source market for Myanmar with the number of Singaporean visitors growing fast at 23% over 2016.
Supply

HVS has noted that, going forward, there will be 17 additional hotels with approximately 4,600 keys in Myanmar by 2021, having four hotels opened in the first quarters of 2018.
Yangon Hotel Performance 2017 vs. 2018F
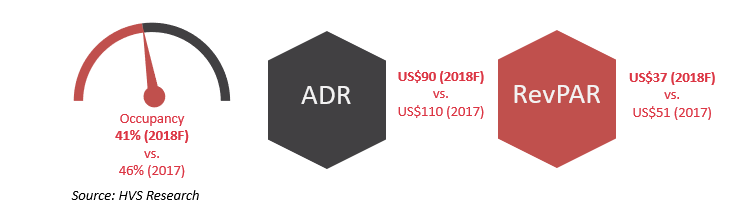
As of YTD July 2018, Myanmar recorded an decrease of 5.2 p.p. in occupancy and a decrease of 19% in ADR y-o-y, with an average occupancy of 41% and an ADR of US$90.
Transactions
There is limited information on hotel transactions in Myanmar. According to the Directorate of Investment and Company Administration (DICA), it was observed that prior to the 2015 presidential elections, investors caution discouraged FDI. However, after the elections in 2016, investors interest returned and a total of US$403.7 million was approved from April 2016 to March 2017. FDI dropped to US$176.8 million from April 2017 to March 2018 due to the political instability in the country. As of September 2018, due to investors uncertainty as Myanmar faces economic sanctions from Western nations for its mistreatment of the ethnic-minority Rohingya, only US$9.5 million has been approved. According to the Ministry of Hotels and Tourism, Singapore is leading the way as one of the biggest investors for Myanmar’s hotels and commercial complexes with approximately US$2.7 billion invested into 26 hotels, an 52% increase from 2016.

Key Points
- Tourism directly contributes 6.0% to GDP in 2017
- 2.9% Real GDP growth expected in 2018
- 3.7 million international tourist arrivals recorded in 2017
Highights
Infrastructure Projects
• NZ$1.8 billion expansion of Auckland International Airport by 2022
New Hotel Openings in Auckland
2018 • SO Sofitel Auckland, 129 keys 2019-2021 • Luxury: 3 Hotels, 745 keys • Upper Upscale: 3 Hotels, 619 keys • Upscale: 3 Hotels, 570 keys • Upper Midscale: 3 Hotels, 465 keys • Midscale: 1 Hotel, 47 keys • Independent: 3 Hotels,185 keys
Notable Transactions
• 178-key Waldorf Stadium Apartment Hotel, located in Auckland CBD, sold for NZ$65 million (NZ$365k/key) in October 2018
Demand
In the first eight months of 2018, tourist arrivals amounted to approximately 2.4 million surpassing last year’s arrivals by 3% over the same period. Given its close proximity, tourists from Australia continue to make up about 39% of total arrivals to New Zealand. Visitation of tourists from United States and UK have achieved healthy y-o-y growths of approximately 13.3% and 12.8% respectively. Both markets have maintained their positions at third and fourth largest source markets. Arrivals from Hong Kong recorded the largest growth in arrivals with 22.2% increase over last year.
Supply

HVS has noted that, going forward, there will be around 35 additional establishments with approximately 5,100 keys by 2021, of which 3 properties with a total of 393 rooms will open by the end of 2018.
Auckland Hotel Performance 2017 vs. 2018F
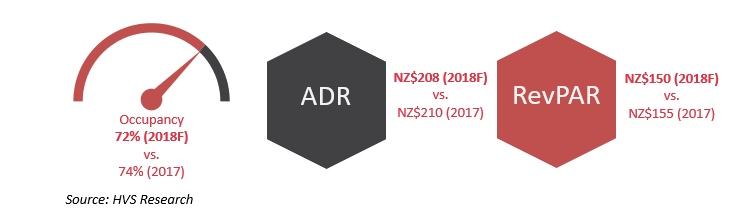
As of YTD July 2018, Auckland recorded a decline of 3.7 p.p. in occupancy and a decrease of 0.1% in ADR y-o-y, with an average occupancy of 70.8% and an ADR of approximately NZ$209.
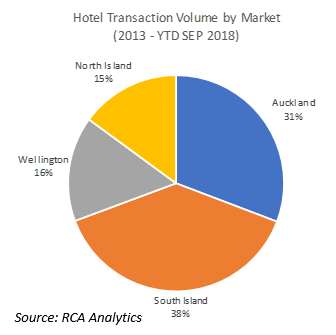
Transactions
Although 2015 and 2016 had been active years, hotel transactions has fallen since 2017. This is possibly due to hotel owners holding onto assets in expectation that the strong tourism market will continue. Approximately one-third of transaction volume are from Auckland while South Island holds the majority with 38%.

Key Points
- Tourism directly contributes 8.7% to GDP in 2017
- 6.6% Real GDP growth expected in 2018
- 6.62 million international tourist arrivals achieved in 2017
Highlights
Infrastructure Projects
• ₱227 billion Metro Manila Subway Project by 2025, backed by Japan • ₱4.6 billion Binondo-Intramuros bridge by 2020, backed by China
New Hotel Openings in Manila
2018 (Top Three Largest Inventory) • Crockfords Tower Bayshore, 400 keys • Sheraton Hotel Manila, 350 keys • Red Planet Hotel Entertainment City, 330 keys
2019-2021 • Luxury: 1 Hotel, 275 keys • Upper Upscale: 3 Hotels, 795 keys • Upscale: 2 Hotels, 435 keys • Upper Midscale: 2 Hotels, 1,488 keys • Midscale: 1 Hotel, 320 keys • Independent: 1 Hotel, 228 keys
Demand
In the first half of 2018, tourist arrivals displayed positive y-o-y growth. YTD June 2018 arrivals of 3.7 million surpassed last year’s arrivals by 10.4%.In the first five months of 2018, South Korea continue to be the top source market while China overtook United States as the second top source market with a significant y-o-y growth of about 44%. Since the launch of The Department of Tourism’s slogan “It’s More Fun in the Philippines” since 2012, there have been an increasing number of tourists. Moving forward, ₱250 million will be allocated to marketing communications campaign with priority placed in international source markets such as South Korea, USA, Canada, Japan, China and Australia.
Supply

HVS has noted that, going forward, there will be 17 additional hotels of approximately 5,200 keys in Manila by 2021, having 11 hotels opened in the first three quarters of 2018.
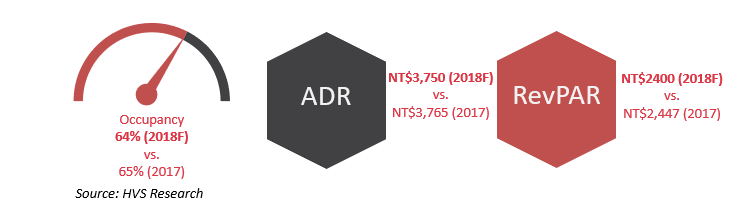
Manila Hotel Performance 2017 vs. 2018F
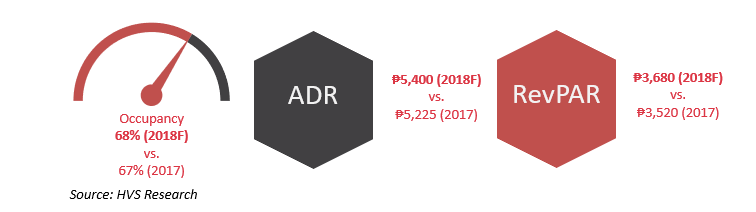
As of YTD July 2018, Manila recorded an increase of 1.1 p.p. in occupancy and an increase of 3.7% in ADR y-o-y, with an average occupancy of 69% and an ADR of ₱5,200.
Transactions
As of YTD October 2018, we noted that there were no hotel transactions. The latest transaction was the acquisition of 49% stake in Hotel 101 Manila by Millennium Global Holdings for an undisclosed amount in March 2017. The only notable transaction was in 2014 which was the sale of the 674-key Shangri-La at the Fort. All transactions recorded were made by local real estate operating companies such as Leisure & Resorts World Corporation, Shang Properties Inc, etc.
Key Points
- Tourism directly contributes 4.1% to GDP in 2017
- 3.2% Real GDP growth expected in 2018
- 17.4 million international tourist arrivals recorded in 2017
Highlights
Infrastructure Projects
• Expansion of Terminal 1 (Project Jewel) by 2019 • Addition of Changi Airport Terminal 5 by 2030
New Hotel Openings in Singapore
2018 • Six Senses Maxwell, 120 Keys
2019-2021 • Luxury: 1 Hotel, 190 keys • Upper Upscale: 1 Hotel, 209 keys • Upscale: 4 Hotels, 1,143 keys • Upper Midscale: 4 Hotels, 873 keys
Notable Transactions
• 33-key Beach Hotel sold for S$31.5 million (S$954k/key) in January 2018 • 157-key The Patina Capitol Singapore sold for S$339.2 million (S$2.16m/key) in May 2018 • 41-key Wangz Hotel sold for S$46 million (S$1.1m/key) in August 2018
Demand
In the first half of 2018, tourist arrivals recorded robust y-o-y growth. YTD June 2018 arrivals of 9.2 million surpassed last year’s arrivals by 7.6%. China continues to be the top source market, making up 20% of total tourist arrivals. This is followed by Indonesia and India at 16% and 8% respectively. In 2018, Singapore Tourism Board announced a new three year partnership with Cruise Lines International Association (CLIA) and a three year tripartite partnership with Costa Cruises to enhance Singapore as a cruise destination.
Supply

HVS has noted that, going forward, there will be 11 additional hotels with 2,534 keys in Singapore by 2021, having three hotels opened in the first three quarters of 2018.
Singapore Hotel Performance 2017 vs. 2018F
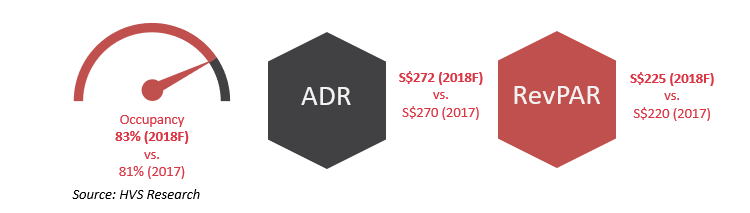
As of YTD July 2018, Singapore recorded an increase of 1.6 p.p. in occupancy and an increase of 0.8% in ADR y-o-y, with an average occupancy of 83.1% and an ADR of almost S$270.
Transactions
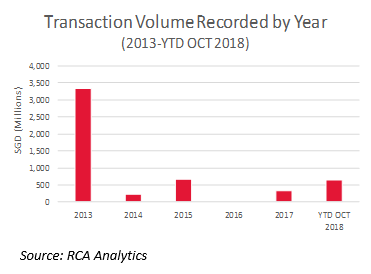 There has been a low volume of investment activity since the peak period in 2013. While no transactions were recorded in 2016, transaction volume has picked up in 2017. As at October 2018, seven hotels were transacted with a total amount of S$656 million. Singapore’s hotel investment market has been dominated by local investors.

Key Points
- Tourism directly contributes 5.1% to GDP in 2017
- 2.9% Real GDP growth expected in 2018
- 13.3 million international tourist arrivals recorded in 2017
Highlights
Infrastructure Projects
• Incheon International Airport Expansion Phase 4 is expected to complete by 2020
New Hotel Openings in South Korea
2018 • Fairfield by Marriott Busan, 162 keys 2019-2021 • Luxury: 4 Hotels, 190 keys • Upper Upscale: 2 Hotels, 661 keys • Upscale: 2 Hotels, 579 keys • Upper Midscale: 4 Hotels, 813 keys • Midscale: 1 Hotel, 186 keys • Independent: 5 Hotels, 2,491 keys
Notable Transactions
• 88-key J Hill Hotel was transacted at KRW97.5 billion (KRW1b/key) in January 2018 • 434-key Conrad Seoul was transacted at KRW124 billion (KRW287m/key) in November 2016 • 103-key Yeouido Park Tower Seoul Marriott Executive Apartments was transacted at KRW87 billion (KRW845 m/key) in December 2016
Demand
South Korea has experienced tough times recently, battling through the MERS outbreak in 2015 and political instability with China in 2017. After reaping the tourism boost from China in the last two years, South Korea recorded significant decline in total visitation from 17.2 million in 2016 to 13.3 million in 2017. Chinese visitor arrivals declined at 48.3% and 3.7% in 2017 and the first half of 2018 respectively. On the other hand, visitation growth from other Asian countries such as Vietnam and Taiwan have mitigated this negative impact. South Korean government and enterprises look to work together to overcome the tensions and slowdown through targeted promotions and campaigns.
Supply

Despite the economic slump, new hotels are set to enter the South Korean market across major cities. More than 3,000 rooms are currently in construction and expected to open by 2020.
Seoul Hotel Performance 2017 vs. 2018F

As of YTD June 2018, hotel occupancy and room rates in Seoul are recording a marginal increase across the board.
Transactions
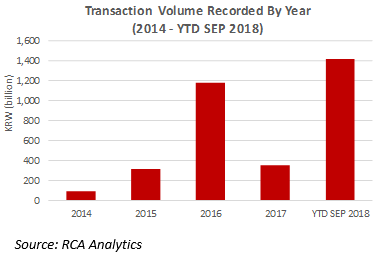 South Korea, specifically Seoul, registered a high volume of investment activity in the recent years, reflecting the health of the hotel investment market. While sales reached KRW1 trillion during the tourism boom in 2016, it was followed by a decline in 2017. Transaction volume picked up in the first three quarters of 2018, exceeding the record achieved in 2016.

Key Points
- Tourism directly contributes 10.4% to GDP in 2017
- 2.6% Real GDP growth expected in 2018
- 10.7 million international tourist arrivals recorded in 2017
Highlights
Infrastructure Projects
• Taiwan Taoyuan International Airport Terminal 3 is expected to complete construction by 2020
New Hotel Openings in Taiwan
2018 • Courtyard Taipei Downtown, 234 keys • Kimpton Taipei Da’an, 129 keys • DoubleTree Taipei Zhongshan, 106 keys 2019 • Hotel Indigo Taipei North, 149 keys
Notable Transactions
• 128-key Capital Hotel was transacted at NT$670 million (NT$5m/key) in February 2018 • 30-key Ido Spa Hotel was transacted at NT$1.3 billion (NT$43m/key) in December 2017
Demand
In 2017, Taiwan encountered economic and tourism challenges. Political instability and tensions with China had a strong negative impact on the country. Fortunately, visitor arrivals to Taiwan maintained a marginal y-o-y positive growth of 0.5% in 2017 despite a substantial decline of Chinese arrivals. Extensive promotions and campaigns for the New Southbound Policy (NSP) increased visitation by 3.8% in the first half of 2018. Moreover, visitation from Philippines and Vietnam, recorded 60.5% and 39.1% y-o-y increase. The NSP is expected to continue its beneficial impact on the Southeast Asian feeder markets in 2018 and onwards.
Supply

New hotels are expected to enter the Taiwan market from 2018 to 2022. Of the total 7,000 rooms, approximately 1,500 rooms are slated to open in Taipei.
Taipei Hotel Performance 2017 vs. 2018F
As of YTD June 2018, hotel occupancy in Taipei trailed by 2 p.p. compared to the same period in 2017. The city’s room rates also reflected the same trend with a slight y-o-y decline of 0.8%.
Transactions
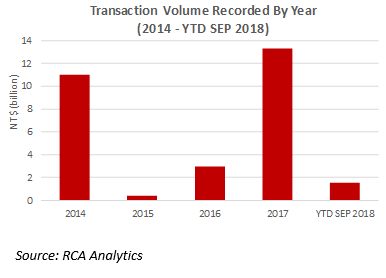 Transaction volume in as at September 2018 remains relatively stagnant as compared to the highest record of NT$29 billion in 2017. Investment activity is predominantly in the Taipei market. From 2014 to September 2018, the sale of Ching-Cheng Building remains as the largest transaction at NT$11 billion.

Key Points
- Tourism directly contributes 9.4% to GDP in 2017
- 4.1% Real GDP growth expected in 2018
- 35.4 million international tourist arrivals recorded in 2017
Highlights
Infrastructure Projects
• Over 100 infrastructure projects worth 3.28 trillion baht in the pipeline including new terminals at Suvarnabhumi International Airport and Don Mueang International Airport. The new developments will increase capacity by 160 million passengers.
New Hotel Openings in Bangkok and Phuket
2018 • Hyatt Regency Bangkok Sukhumvit, 273 keys • Hotel Indigo Phuket Patong, 180 keys • Vib Sanampao Bangkok, 89 keys
2019-2021 • Luxury: 4 Hotels, 713 keys • Upper Upscale: 2 Hotels, 523 keys • Upscale: 3 Hotels, 493 keys • Midscale: 5 Hotels, 1,951 keys • Economy: 5 Hotels, 1,112 keys
Notable Transactions
• 726-key Royal Orchid Sheraton Hotel and Towers in Bangkok was sold at 3.6 ฿ billion (12.5 ฿ m/key) in April 2018
Demand
YTD August 2018 arrivals of 23.0 million outstripped last year’s arrivals by 11%. China remains the number one source market for Thailand with a YTD growth of 17% despite a culmination of incident resulting Chinese tourist arrivals reportedly falling by 12% month-on-month (m-o-m) in August 2018. YTD figures indicate continued growth in regional East Asian travellers with a 12% growth compared to 2017.
Supply

HVS has noted that, going forward, there will be 90 additional hotels with approximately 20,700 keys by 2021, with a large focus on branded upscale properties. Furthermore, 30 properties with over 6,700 keys are slated to open across Thailand in 2019.
Bangkok and Phuket Hotel Performance 2017 vs. 2018F
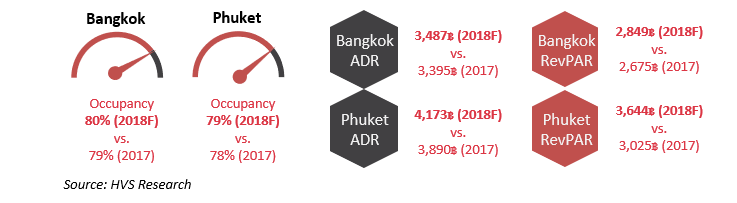
Both Bangkok and Phuket hotels sampled over various positioning, recorded a healthy occupancy of 79% and 78% respectively, with ADR above the 3,000 mark in both cities, with Phuket achieving a higher RevPAR of 3,025 in 2017. Going forward, Bangkok and Phuket are expected to enjoy strong growth in terms of RevPAR and ADR in line with the tourism growth experienced throughout Thailand.
Transactions
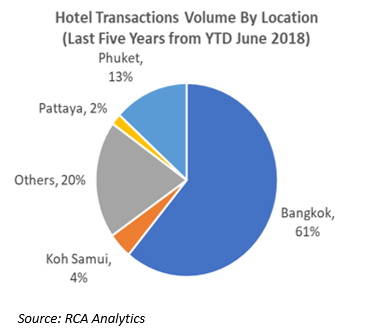
With fourteen transactions recorded as of YTD June 2018, investment activity in Thailand has increased significantly from just four transactions in June 2017. Sales prices of those four transactions recorded approximately 1.3฿ million to 49.5฿ million per key.

Key Points
- Tourism directly contributes 5.9% to GDP in 2017
- 6.9% Real GDP growth expected in 2018
- 12.9 million international tourist arrivals recorded in 2017
Highlights
Infrastructure Projects