The U.S. Department of Commerce today announced that the United States welcomed 23 million international visitors(1)(2) during the first four months of 2015-640,000 more than in the first four months of 2014-a three percent increase in visitors.
April 2015 marked the 16th consecutive month of growth in total U.S. visits since January 2014. 6.5 million international visitors traveled to the United States in April, up 0.4% compared to April 2014.
HIGHLIGHTS (2)(3) Top Inbound International Markets
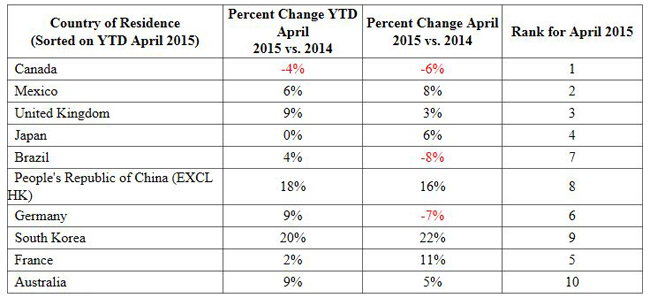
- The top inbound markets continued to be Canada and Mexico. Overnight volume from Canada totaled 7 million visitors during the first four months of 2015, a four percent decline (-4%) compared to the first four months of 2014. At the same time, Mexico recorded 5 million visits to the United States, an increase of six percent. The United Kingdom (+9%), Japan (0) and Brazil (+4%) rounded out the top five inbound markets.
- During the first four months of 2015 nine of the top 10 countries posted increases in non-resident visits. Non-resident visitation from two of the top 10 countries registered double-digit increases.
- In April 2015 seven of the top 10 countries posted increases in visitation to the United States.
Top 10 Countries
Regional Markets
- Eight of the nine(4) major overseas regional markets recorded an increase in non-resident visits to the United States during the first four months of 2015: Western Europe (+7%), Asia (+10%), South America (+1%), Oceania (+10%), Middle East (+11%), the Caribbean (+11%), Central America (+5%), and Africa (+9%)
- Eastern Europe (-9%) recorded a decrease in visits to the United States for the first four months of 2015.
Non-Resident Visits from Overseas(5) Countries
- YTD April 2015 non-resident visits from overseas countries (10.6 million) were up seven percent over the same period in 2014.
- Travel from overseas markets accounted for 46 percent of total arrivals to the United States during the first four months of 2015.
- April 2015 overseas resident visits (3 million) were up one percent compared to April 2014.
Top Ports: YTD April 2015
- YTD April 2015 visitation through the top 15 ports of entry accounted for 86 percent of all overseas visits-a percentage point less than last year.
- The top three ports (New York [JFK], Miami, and Los Angeles) accounted for 42 percent of all overseas arrivals-about the same as last year.
- Thirteen of the top 15 ports recorded increases in arrivals in the first four months of 2015. Eight of these ports recorded double-digit increases.
Pleasure Travel vs. Business Travel
- During the first four months of 2015, of the top 20 overseas countries with visits to the United States, more than 90 percent of the visits recorded from Brazil (91%), Argentina (92%) and Ecuador (93%) represented pleasure travel to the United States. On the contrary, 25 percent or more of the visits recorded from Germany (27%), Italy (25%), India (26%), the Netherlands (32%) and Ireland (25%) represented business travel to the United States.
- During the first four months of 2015 for all overseas non-resident visits to the United States, 78.1 percent represented pleasure travel and 17.2 percent represented business travel.
Access to NTTO Data The National Travel and Tourism Office (NTTO) collects, analyzes and disseminates international travel and tourism statistics from the U.S. Travel and Tourism Statistical System. NTTO produces visitation data tables, including more detailed regional, country and port analyses. To access these data, you are encouraged to visit the NTTO monthly arrivals page at http://travel.trade.gov/view/m-2015-I-001/index.html.
National Travel and Tourism Strategy In 2012 a Task Force on Travel Competitiveness, co-chaired by the Secretary of Commerce and the Secretary of the Interior, developed the National Travel and Tourism Strategy to promote domestic and international travel opportunities throughout the United States and increase the United States’ market share of worldwide travel. The Tourism Policy Council, chaired by the Department of Commerce, is leading the implementation of the National Strategy through inter-agency working groups, including a Research Working Group chaired by NTTO. The I-94 Program supports the National Strategy’s call for expanded metrics on international travel to the United States. I-94 automation further supports this initiative as it greatly improves the measurement of international visitation data to the United States. To learn more about the National Strategy, you are encouraged to visit http://travel.trade.gov/pdf/national-travel-and-tourism-strategy.pdf. For more information on I-94 automation, please visit http://www.cbp.gov/travel/international-visitors/i-94-instructions.
(1) This report integrates the volume of inbound international visitors to the United States from residents of other countries using three U.S. and international government sources: the U.S. Department of Homeland Security/U.S. Customs and Border Protection I-94 arrivals program data, Statistics Canada’s International Travel Survey and Banco de Mexico travel data.
(2) 2014 and 2015 arrivals data include a technical-processing change that increases the 1+ night visitor counts for overseas countries compared to previous years (prior to 2014). This processing change does not impact Canada or Mexico visitor counts. Also, the 2014 and 2015 arrivals data include a methodology change where the Country of Citizenship is used as a substitute for those I-94 records with missing Country of Residence data. I-94 arrivals monthly data is released as preliminary data, with these data subject to revisions that may be possible with improved solutions and/or sources discovered during the reported calendar year. For more information about these changes to the monthly I-94 arrivals program, visit the NTTO website at: http://travel.trade.gov/research/programs/i94/description.html.
(3) Throughout this report, percent changes posted for international visits to the United States for percent changes posted for year to date 2015 were calculated by comparing data for January – April 2015 to data for January – April 2014. Also, percent changes for April 2015 were calculated by comparing data in April 2015 to data in April 2014.
(4) The nine major overseas regions are: Western Europe, Eastern Europe, Asia, the Middle East, Africa, Oceania, South America, Central America and the Caribbean.
(5) Overseas includes all countries except Canada and Mexico.