In a new twist, domestic leisure lags domestic business
WASHINGTON (November 1, 2016)—Recent interest among international travelers in the U.S. as a destination seems to have materialized into actual trips, according to the U.S. Travel Association's latest Travel Trends Index (TTI).
International inbound travel growth remained positive throughout the third quarter, though it is expected to weaken slightly in the coming months. In the next six months, domestic leisure will remain the primary driver of U.S. travel.
"The American travel economy has thus far successfully weathered Zika, Brexit, a volatile presidential campaign and a powerhouse U.S. dollar," said U.S. Travel Association President and CEO Roger Dow. "Since 9/11, this industry has repeatedly proven itself to be one of our economy's sturdiest performers in terms of its ability to grow and create jobs in the face of challenges."
Meanwhile, domestic business travel in September outpaced domestic leisure travel for the first time in over a year. U.S. Travel analysts posit that domestic business travel's sudden burst of energy was likely due in part to the shift of the Jewish holidays (Rosh Hashanah and Yom Kippur) to October. TTI indicators show that this will probably remain only marginally positive through year-end.
The slow September growth for domestic leisure travel—long the leading performer among travel segments—portends an overall weakening in travel growth for the next few months. Despite its current sluggishness and lag behind domestic business travel, domestic leisure will likely lead the U.S. travel market into the first quarter of 2017.
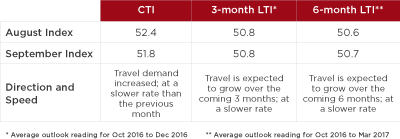
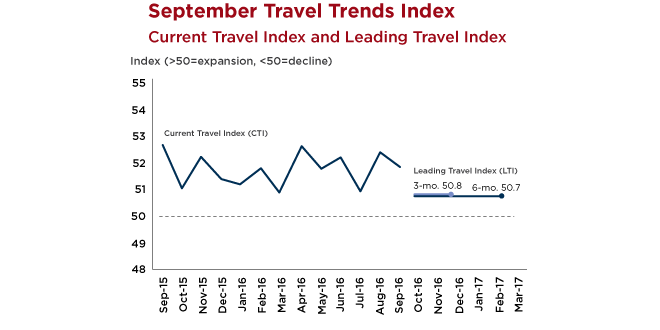
In the full TTI report, the 3- and 6-month LTI readings of 50.8 and 50.7, respectively, indicate that U.S. travel volume is expected to grow at a year-over-year rate of around 1.5 percent through March 2017.
The TTI consists of the Current Travel Index (CTI), which measures the number of person-trips involving hotel stays and/or flights each month, and the Leading Travel Index (LTI), which measures the likely average pace and direction of business and leisure travel, both domestic and international inbound. It assigns a numeric score to every travel segment it examines—domestic and international, leisure and business—in current, 3-month and 6-month predictive indicators. As with many indices similarly measuring industry performance, a score above 50 indicates growth, and a score below 50 indicates contraction.
The U.S. Travel Association developed the TTI in partnership with Oxford Economics, and draws from multiple data sources to develop these monthly readings. In order to compile both the CTI and LTI readings, the organization's research team utilizes multiple unique non-personally identifiable data sets, including:
- Advance search and bookings data from ADARA and nSight;
- Passenger enplanement data from Airlines for America (A4A);
- Airline bookings data from the Airlines Reporting Corporation (ARC); and
- Hotel room demand data from STR.
Learn more about the Travel Trends Index.
Click here to read the full report.