By Chelsey Leffet
Washington, D.C. holds a worldwide reputation as a city rich in history and political power. As the nation’s hub of political affairs, it is the center of governmental action and policy in the U.S. Aside from places like Capitol Hill, Embassy Row, the National Mall, and historic Georgetown, the metropolitan area also boasts a diverse concentration of national and international organizations and associations. Although the federal government remains the dominant influence in D.C., a diverse array of industries and institutions have contributed to and supported the growth and expansion of the region. The finance, education, healthcare, and scientific research-and-development industries are strongly represented in and around the District, and the region is home to 20 colleges and universities, as well as multiple major regional hospitals.
Key Lodging Demand Generators
Tourism and Visitation
Tourism is a major influence on the Washington, D.C. economy and a significant demand generator for the lodging market. The city is the eighth most popular destination in the U.S., after New York, Miami, Los Angeles, Orlando, San Francisco, Las Vegas, and Honolulu. In 2017, a total of 22.8 million people visited the D.C. The most popular tourist destinations are the National Parks (44.4 million visitors in 2017) and the Smithsonian museums on the Mall (30.0 million visitors in 2017). The following graph illustrates Destination DC’s count of the total visitation to the city; the data include both domestic and international visitors.
Total Visitation
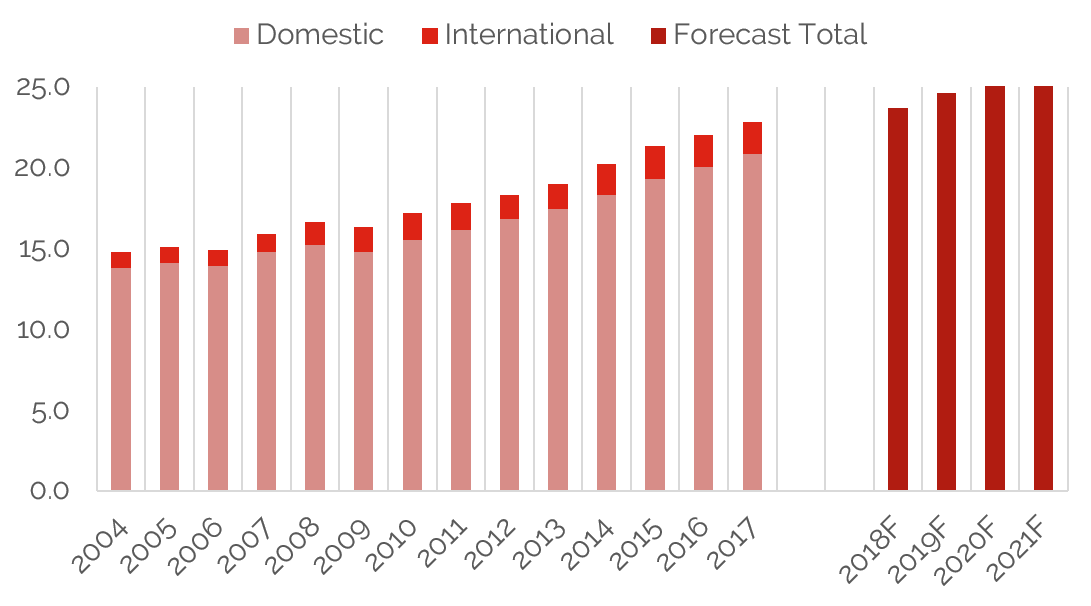
Source: Destination DC
The 20.8 million domestic visitors recorded in 2017 represent an 800,000 increase over 2016. Forecasts by Destination DC anticipate that visitation will continue to increase over the next several years. Total visitation is expected to reach 26.1 million by 2021; thus, leisure demand is expected to rise in tandem. As one would suspect, the hospitality industry is one of the District’s strongest employers, accounting for over 80,000 jobs. The Bureau of Labor Statistics (BLS) reported that, within the greater Washington metropolitan area, leisure and hospitality had the largest employment gain from January 2017 to January 2018, adding 13,000 jobs, twice that of the national average in this employment sector.[1] Hospitality employment figures include restaurants, and D.C.’s expanding restaurant scene has contributed to this increase. Furthermore, the BLS reported that D.C.’s professional and business services employment increased 3.0% from July 2017 through July 2018, higher than the national increase at 2.6%.
Transportation
The Washington, D.C. lodging market greatly benefits from the availability of three airports and over 2,200 flights in and out of the city each day. This ease of access facilitates travel across all segments. The passage of the FAA Reauthorization Bill in 2012 increased the number of takeoff and landing slots at Ronald Reagan Washington National Airport (DCA); the expansion of service at this conveniently located airport has resulted in over 4.2 million additional passengers annually. During the same period, Baltimore-Washington International Thurgood Marshall Airport (BWI) recorded 1.4 million additional passengers, and Washington Dulles International Airport (IAD) 1.4 million fewer passengers, primarily due to changes in flight service. IAD recently underwent major renovations, including the addition of a fourth runway, a new air-traffic-control tower, expanded gates, two new parking garages, and an automated vehicle to transport passengers to their gates (Aero Train), all of which are expected to support the recovery and growth of this airport. Moreover, the extension of the Metrorail service to IAD will significantly improve the accessibility of this airport and should enhance the appeal and utilization of this facility. BWI completed a $60-million expansion last spring, and DCA also just started its $374-million expansion in June 2018, which is part of a larger $1-billion terminal redevelopment plan to be completed in 2021.
The following charts illustrate the passenger statistics through 2017 at the three major airports.
Airport Passenger Statistics
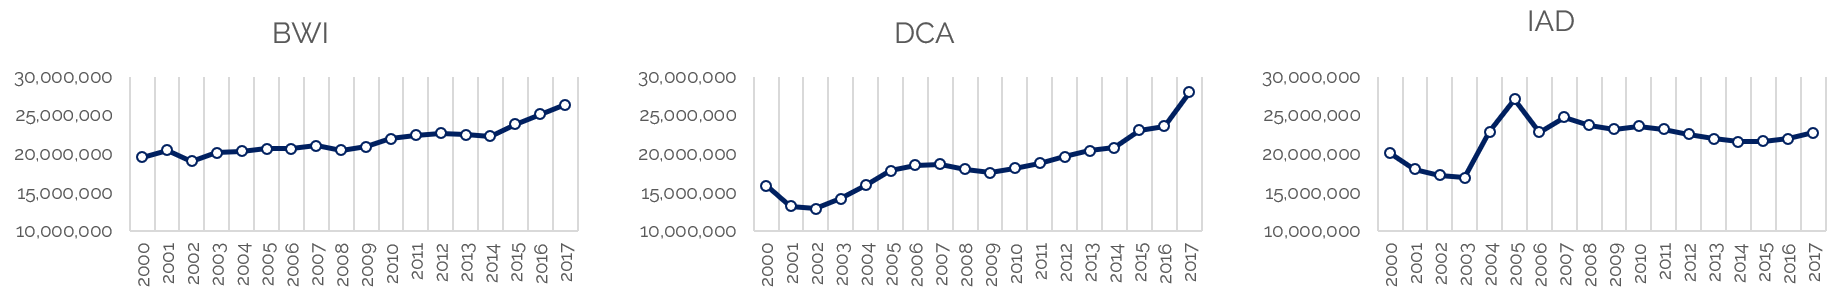
Source: Ronald Reagan Washington National Airport, Baltimore-Washington International Thurgood Marshall Airport, Washington Dulles International Airport
The Metrorail system also plays an essential role in the District’s transportation system, as it provides efficient access to other regional locations relevant to many businesses and tourist destinations. The Metro has an annual ridership of 271 million people, making it the second-busiest rapid transit system in the nation. In 2018, it was announced that $500 million a year in new, dedicated funding was expected from the District, Maryland, and Virginia for capital improvements to the Metro. The Washington Union Station is also a primary rail transit hub for long-distance Amtrak travelers. It is one of the busiest train stations in the U.S. and serves as Amtrak’s headquarters. Over 3.8 million passengers pass through Union Station annually, excluding local daily commuters.
Convention Activity
The convention segment has been a key driver of group demand in the market. The Walter E. Washington Convention Center (WEWCC) opened in 2003, replacing a dated, inadequate facility that had limited the market’s opportunities to participate in the convention segment. The WEWCC encompasses 2.3 million square feet, with 703,000 square feet of exhibit space and 77 individual/customizable meeting rooms that have the capacity to accommodate small events and breakout meetings to events of up to 42,000 attendees.
WEWCC Event and Attendee Statistics
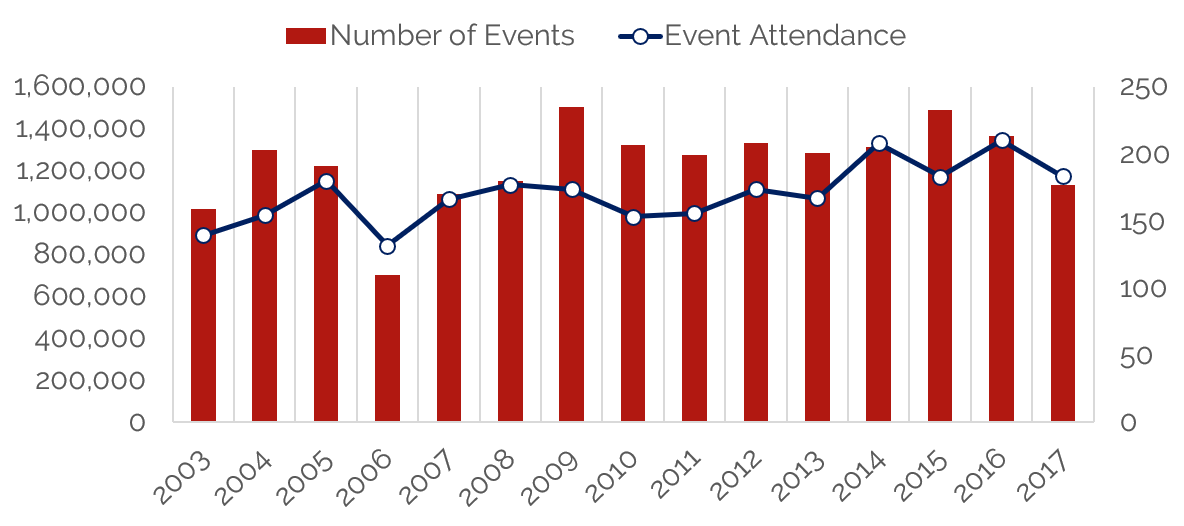
Source: Washington Convention Center
Government, entertainment, and trade/business events have continued to inject millions of dollars into the local economy annually. With the opening of the Marriott Marquis in 2014, attendance surpassed the 1.3-million mark for the first time since the new center opened. The hotel has helped to bolster the WEWCC’s event calendar and citywide bookings. More significantly, the mix of events has shifted to include a greater number of citywide events (defined by the market as conventions that require more than 2,500 room nights on the peak night). The following graph illustrates room nights (historical and projected) associated with convention bookings, as tracked by Destination DC.
Citywide Room Nights Booked
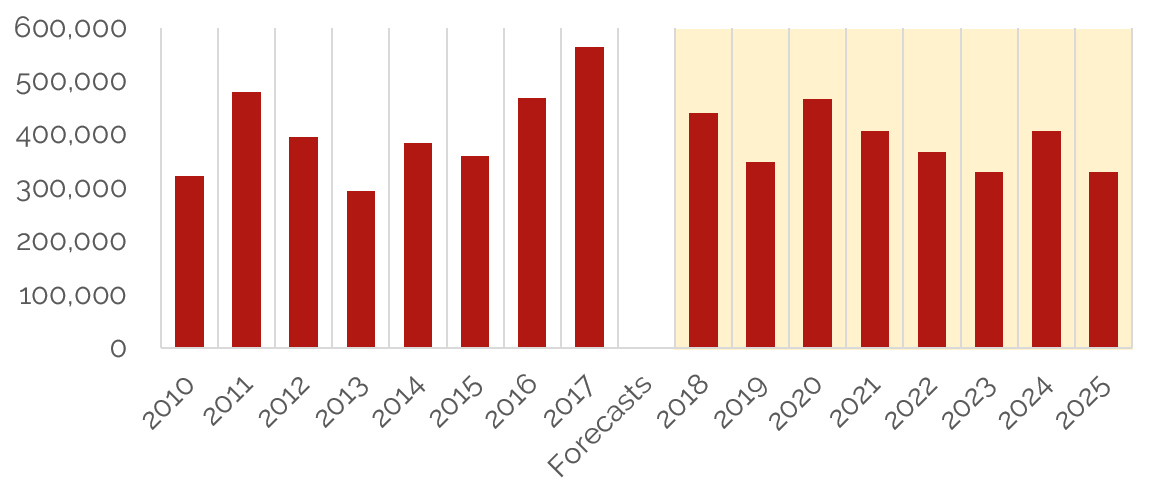
Source: Destination DC
The number of market-wide conventions increased in 2016, displacing some of the smaller regional or local events and thus causing a drop in total events versus 2015. The overall number of events and convention attendance declined slightly in 2017; however, citywide room nights increased. This year and next year’s events on the books are also currently showing a decline, but Washington, D.C. continues to be a popular convention destination for meeting planners and attendees. The government and local institutions are a valuable resource in terms of speakers and panelists, and there are numerous venues for special events to complement the convention center’s facilities.
Citywide bookings increase the number of hotel rooms that benefit from convention activity while also limiting the inventory available to other demand segments, creating the opportunity to maximize average rates. Furthermore, it is evident from the above graphic that when the government goes into sequestration, the convention center attendance and hotel room nights booked are directly affected, as illustrated by the decline in 2013. In 2017, 22 citywide events were booked; this number is expected to decline to 19 in both 2018 and 2019.
Office Market
Washington, D.C.’s office market is divided into six principal submarkets comprising a total of 138 million square feet. According to REIS, occupied office space and average asking lease rates for the D.C. office market have increased consistently, albeit at a modest pace. The market has also experienced a general downsizing trend brought about by more efficient uses of space; the relocation of government entities from leased space to government-owned buildings has also contributed to this trend. The average vacancy rate for the past ten years has consistently been around 10%, and this number is forecast to increase to roughly 12.5% by 2025, according to REIS. Average asking rents are also anticipated to continue to rise due to increasing demand for Class-A office space and decreasing demand for Class-B and Class-C office space. Historically, the market comprised a relatively large proportion of Class-B and Class-C office space. Prior to 2000, this space accounted for more occupied office space than the Class-A sector. With the influx of significant new supply over the past two decades, Class-A space now dominates the market. This new space is occupied by an array of public and private entities, reflecting the emergence of the city as a business locale. The spread between Class-A office space occupancy and Class-B and Class-C office space occupancy has only grown since that time, as illustrated by the following chart.
Occupied Office Space by Class Rating
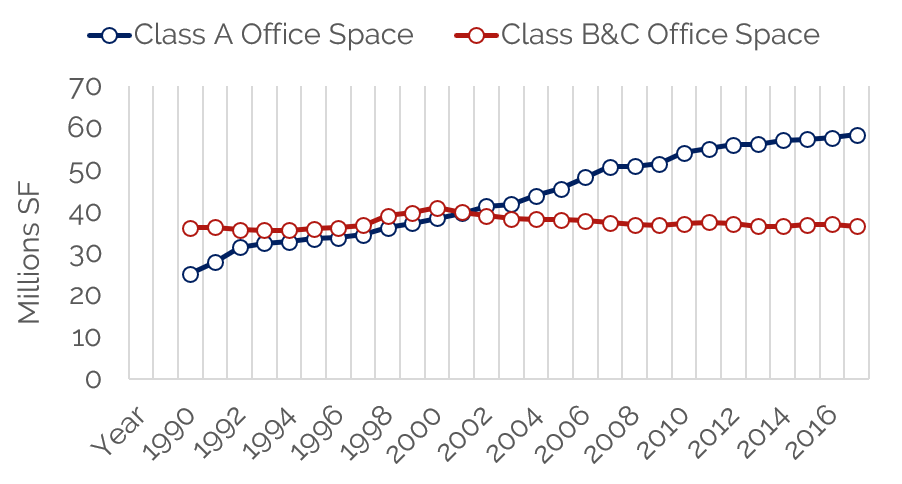
Source: REIS
The office supply and demand trends are similar to those of the D.C. hotel market, with the data points reflecting a period of slow and steady growth for Class-A office space. The following graph illustrates the changes in historical office vacancy rates, compared to the hotel occupancy rates.
Office Vacancy Rates vs. Hotel Occupancy Rates
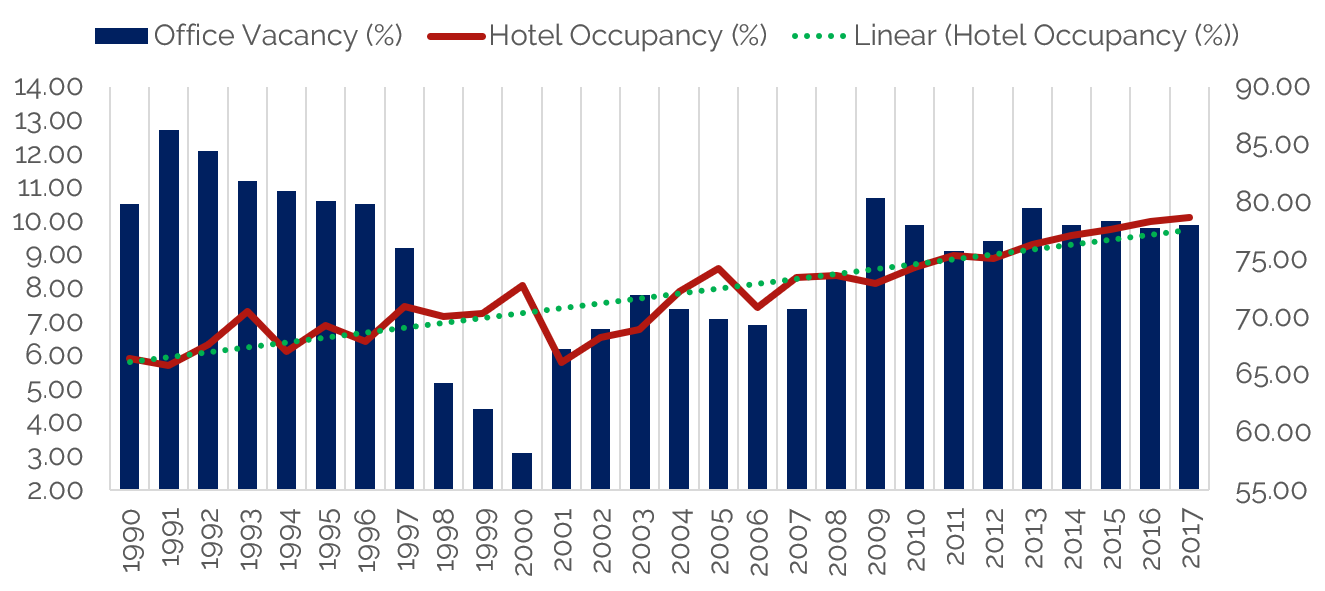
Source: REIS
New supply trends for both office and hotel development are focused on high-quality properties at higher price points (i.e., upper-upscale/luxury hotels and Class-A office buildings). The anticipated growth in Washington, D.C.’s hotel supply also mirrors that of the forecast of office supply growth over the next several years, as the revitalized neighborhoods of Northeast, Southeast, and Southwest D.C. continue to generate demand and attract the interest of hotel developers. The following chart shows the ratio of occupied office space to occupied hotel rooms in the District since 1990.
Room Nights per 1,000 Square Feet of Occupied Office Space
Source: REIS
Since 2000, only during times of economic turmoil and/or government sequestration have the hotel room nights occupied in D.C. not trended similarly to the occupied office space, as illustrated above. Given the transient nature of hotels, some fluctuation moving forward is to be expected; however, the correlation in recent years between occupied office space and occupied hotel space is substantial.
Government & the Federal Per Diem
As noted previously, the Washington, D.C. hotel market was negatively affected by the sequestration in 2013. However, following the end of the sequester, the federal government enacted several measures to increase both defense and non-defense discretionary spending. Government travel and spending has returned to the D.C. market, and booking windows for government business have been extended, as average daily rate (ADR) growth has affected the market. Additionally, smaller group conferences are occurring, as overall government funding allocations have increased. Large-scale government (both national and international), government contractors, tourism, and local businesses all continue to provide consistent sources of lodging demand for the Washington, D.C. metro market.
Demand generated directly by government entities, and much of the demand generated by contractors and vendors that service those government entities, is subject to the federal per diem. Although the per diem varies by season, this rate is an anchor for the market and serves as a benchmark for corporate and group rates. This controlled downside provided by the government sector comes with some limitations. Given the magnitude of demand that is tied to this rate, it can be challenging for the larger market to achieve ADR growth beyond the per diem’s rate of change. Historical per-diem rates per the fiscal year (October 1 through September 30) are illustrated in the following chart.
Federal Per Diem Rates
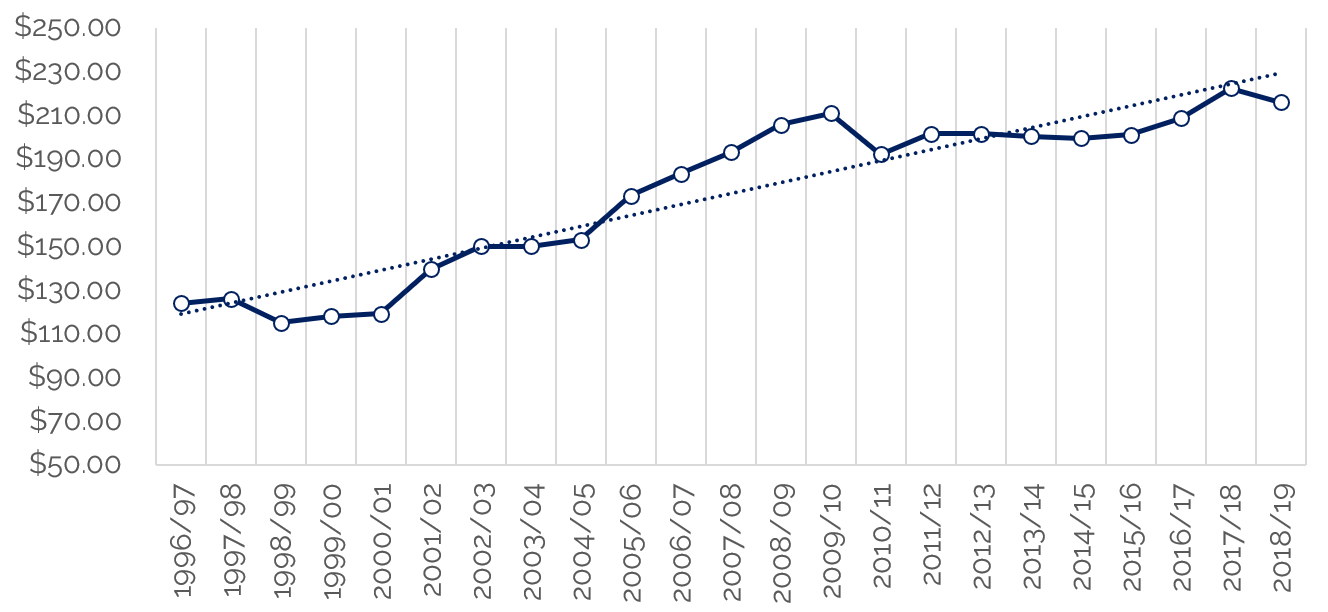
Source: REIS
The per diem for each fiscal year is based on the market performance during the prior year; thus, growth typically lags the market's trends by one year. After a period of year-over-year strengthening, the per-diem rate dropped notably in 2010/11, as the impact of the recession affected prevailing room rates. The average per-diem rate increased to $201.51 in 2011/12, reflecting a partial recovery from the $19 decline in 2010/11. For the following five years, through 2015/16, the rate fluctuated in a narrow range between $199 and $201. This period of stagnancy aligns with the minimal changes in ADR recorded by the greater Washington, D.C. market from 2009 through 2014. The improvement in average rate recorded for the Washington, D.C. metropolitan market in 2015 supported the 3.7% increase in the per diem, as reflected in the published rate for 2016/17. The strong demand growth trends in 2017, driven primarily by the strong convention calendar and the influx of visitors for the Presidential Inauguration and Women's March, created a significant amount of compression, which allowed for further rate growth that year and translated to an increase in the federal per diem for the 2017/18 period. However, the recently published per diem for 2018/19 shows a modest decline, reflective of a correction from the premium rates achieved in the first quarter of 2017.
Historical Lodging Market
Major Market
The Washington, D.C. metropolitan area remains one of the most resilient regions in the nation, with an economy propelled by strong growth in the business and professional service sectors, as well as substantial economic stability provided by the federal government. The region has seen the emergence of a more diverse and dynamic economy that features the country’s largest technology cluster and rapidly growing biotech and aerospace industries. Due to the federal government’s presence and the related industries located nearby, D.C. has the highest concentration of office-using jobs in the nation. Its unemployment rate, according to the BLS, was 3.4% as of December 2017. Additionally, the District boasts the highest educated population base in the nation, with 48% of the region’s workforce holding a bachelor’s degree, and 23% holding a graduate degree. The federal government, international business, technology, and hospitality sectors are (and should continue to be) key economic engines.
Although the levels of demand fluctuated during the recession and subsequent government shutdown and sequestration, the volume of travel related to government activity, accompanied by strong tourist visitation, creates a stable base of lodging demand. As a result, the D.C. metro market has sustained occupancy in the low 70s, even in the slowest years; moreover, this stability extends to ADR given to the influence of the federal per-diem rate. While RevPAR for the top 25 U.S. metropolitan markets during the worst of the recession declined 19% in 2009, the D.C. metro area experienced only an 8.6% decline. ADR also fell by only 5.5% that year in the D.C. metro market, compared to over 22% in New York City, and approximately 15% in Chicago and San Francisco. The following chart illustrates the RevPAR comparison for the top five major metropolitan areas.
Major Market RevPAR Comparisons
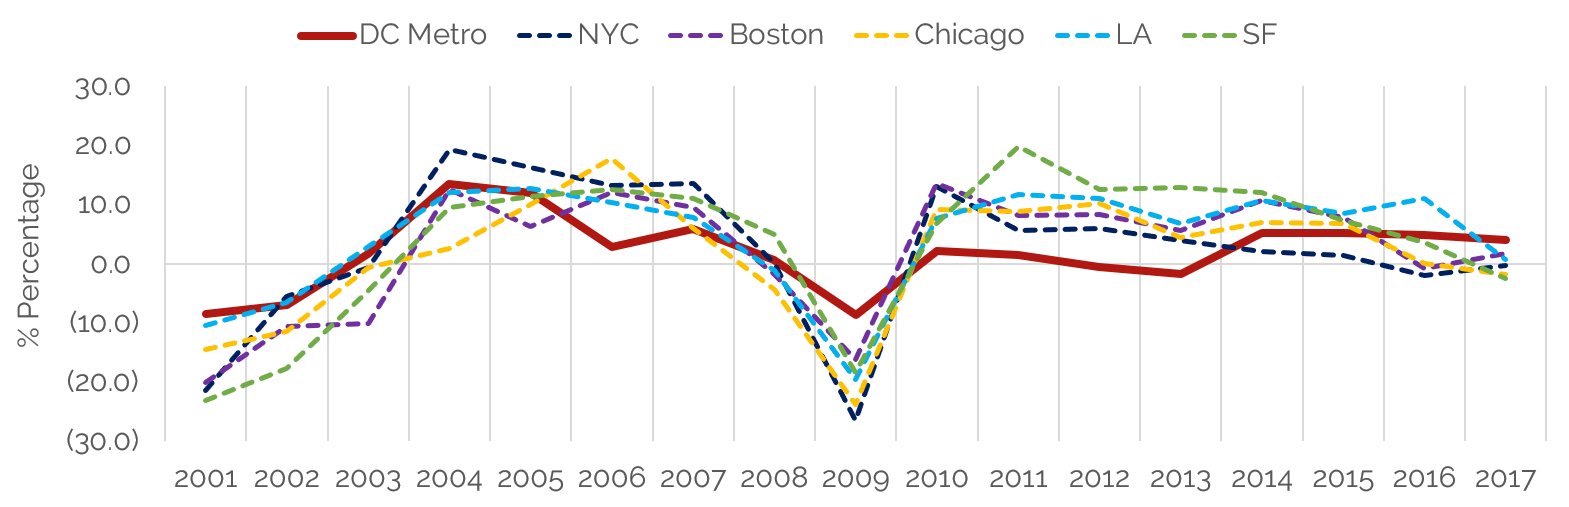
Source: HVS, STR
The Washington, D.C. area's hotels occupancy and ADRs have risen over the past several years; the collection of corporate, government, and educational institutions continues to support an economy that is relatively resilient to major downturns on a national level and is notably one of the most stable of the major U.S. markets.
Washington, D.C.
Lodging-market fundamentals in Washington, D.C. radiate outward to the suburban areas of Virginia and Maryland. The hotel operational data in the suburban areas are directly affected by the market conditions within D.C. proper. Due to the growth of the hotel sector in Washington, D.C., the RevPAR gap between the District and the outlying metropolitan area has continued to increase.
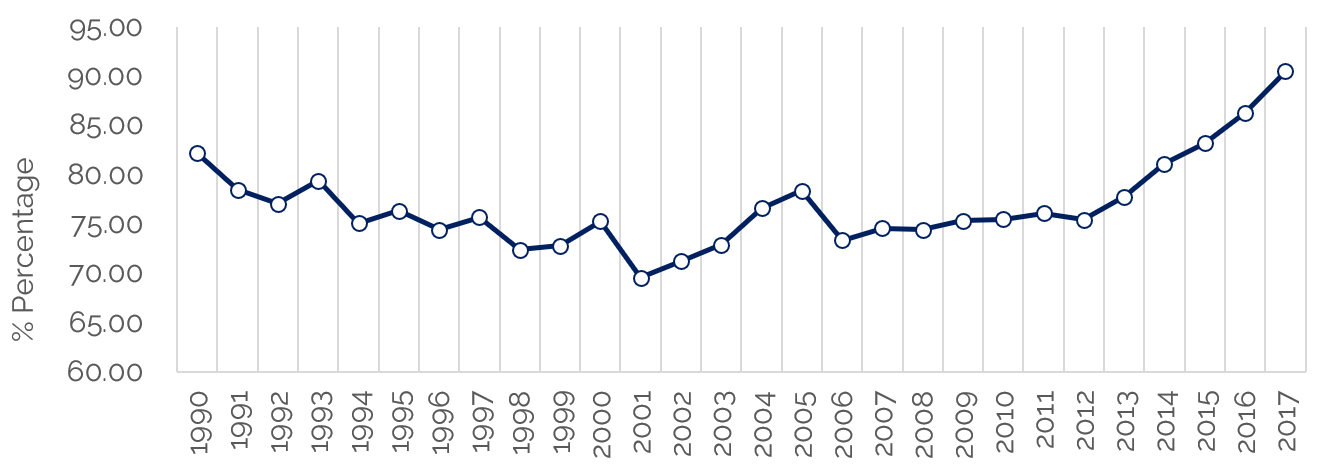
Specific to Washington, D.C., lodging trends differ slightly from the overall metropolitan area. For example, occupancy for the major market, which includes D.C. and portions of Maryland and Virginia, has yet to surpass its 2000 occupancy peak of 73.3%. Comparatively, occupancy in the Washington, D.C. lodging market surpassed its 2000 occupancy peak of 72.8% in both 2008 and 2009, while many other cities were struggling to maintain occupancy levels given the recession. The following illustration encapsulates the District of Columbia’s lodging market occupancy and ADR performance, apart from the entire Washington, D.C. metropolitan area, over the past thirty years.
District of Columbia Occupancy and Average Rate
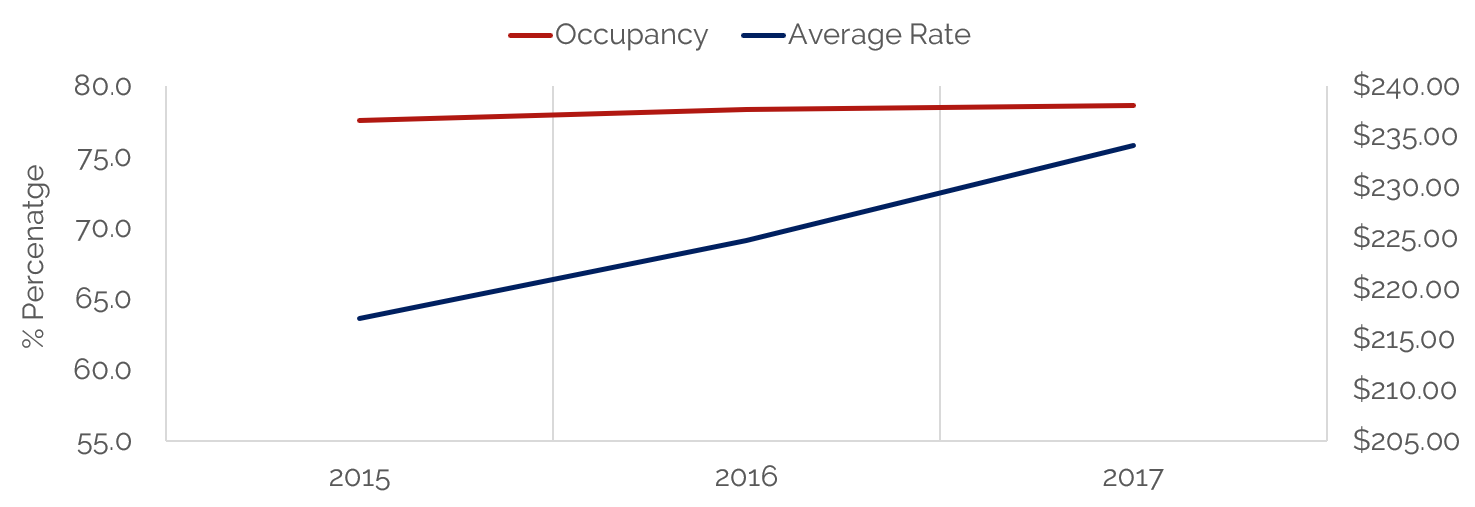
Source: HVS, STR
ADR in Washington, D.C. remained essentially flat between 2009 and 2014. However, as government demand stabilized in 2015, ADR and RevPAR grew by 2.5% and 3.1%, respectively. ADR growth was also supported by the opening of new, higher-rated hotels, supplemented by increased activity in the commercial and convention sectors of the market. Occupancy, ADR, and RevPAR have all been growing steadily ever since, with 2017 marking the highest-ever occupancy level of 77.8%, ADR of $234.15, and RevPAR of $184.19. The introduction of new supply is a cautionary note, but various government-related events and steady convention calendars will likely offset any drops in occupancy in the next couple years.
Historical & Existing Hotel Supply
The District of Columbia offers roughly 145 hotels, totaling more than 31,500 rooms. The market has experienced a significant amount of new hotel supply since the 1960s.
Historical Hotel and Room Additions
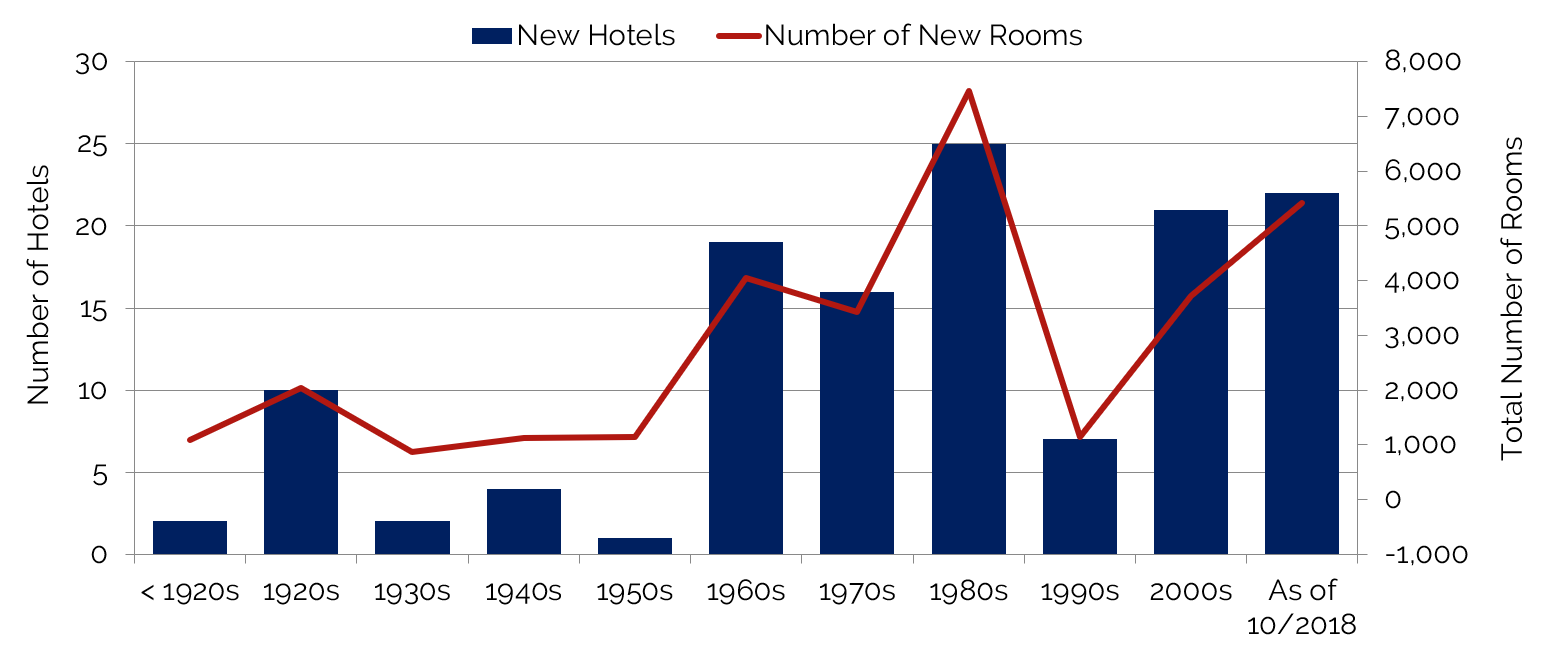
Source: HVS, STR
The market’s breakdown by chain scales is in line with national trends for economy, midscale, upper-midscale, and upscale hotels; however, approximately 40.7% of all guestrooms in the D.C. metropolitan area are classified as upper-upscale, representing a proportionately greater share of the market when compared with similar markets in the U.S. It should be noted that the inventory landscape has changed over the past three decades. While the upper-upscale chain scale dominated inventory and development in the 1980s and early ’90s, hotel development and the overall inventory landscape began to shift with the advent of the upscale, select-service product type. Roughly 50% of the new development in the 1990s consisted of the upscale, select-service hotel product, moving the “upscale” needle from only 3% of total rooms in 1980 to 16% of total rooms available in 2017, as illustrated below.
Hotel Class Inventory Comparison: 1980 vs 2017
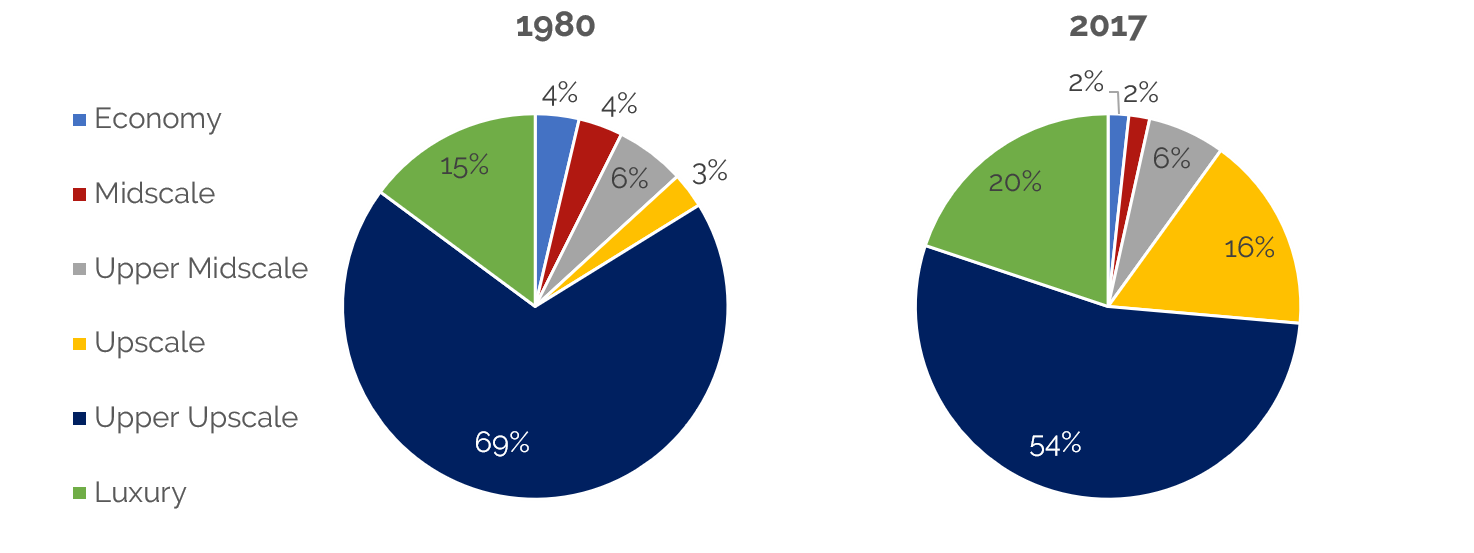
Source: HVS, STR
Nevertheless, the upper-upscale sector continues to dominate the D.C. market, and the changes within this sector have been dynamic, with hotels undergoing significant renovations and changes in affiliation. In the 1990s, ten upper-upscale hotels changed affiliation, while twelve hotels did so in the 2000s; between 2010 and 2017, another 17 upper-upscale hotels changed affiliations. The insurgence of soft branding and boutique hotels are a big part of this trend, including the conversion of the DoubleTree by Hilton to The Darcy, a Curio Collection hotel with Hilton; the Madison Hotel’s affiliation with Hilton; and the entrance of new boutique hotels, such as The Line DC, which opened in December 2017.
Hotel inventory in D.C. proper has increased by 5,418 rooms (20.8%) since 2010; moreover, roughly 700 new guestrooms are expected to be added by the end of 2018. This represents a sizable increase in hotel supply; however, new supply over the past decade has been readily absorbed, and the proposed supply is anticipated to only impact the market's overall performance modestly. Upper-upscale and luxury hotels, attractive to developers given their ability to command the highest ADRs, are expected to continue to dominate the new supply pipeline through 2020.
Supply Pipeline
Pipeline Supply
Currently, around 35 hotels are either proposed or reportedly planned for this market. These projects are in varying stages of development, and it is unlikely that all will come to fruition, but supply is expected to increase roughly 15% by 2020. Although this volume of new supply is significant, it is notable that the market readily absorbed the hotels that opened within the past decade; in fact, demand growth has outpaced supply increases. Nevertheless, the influx of new hotels is anticipated to cause some competitive pressure that will affect market-wide occupancy and ADR levels. Market occupancy is expected to fall modestly, by approximately one percentage point, in the near term as four new hotels open by year-end 2018; moreover, as new supply continues to open through 2010, hotel operators are likely to lower ADRs in an effort to remain competitive.
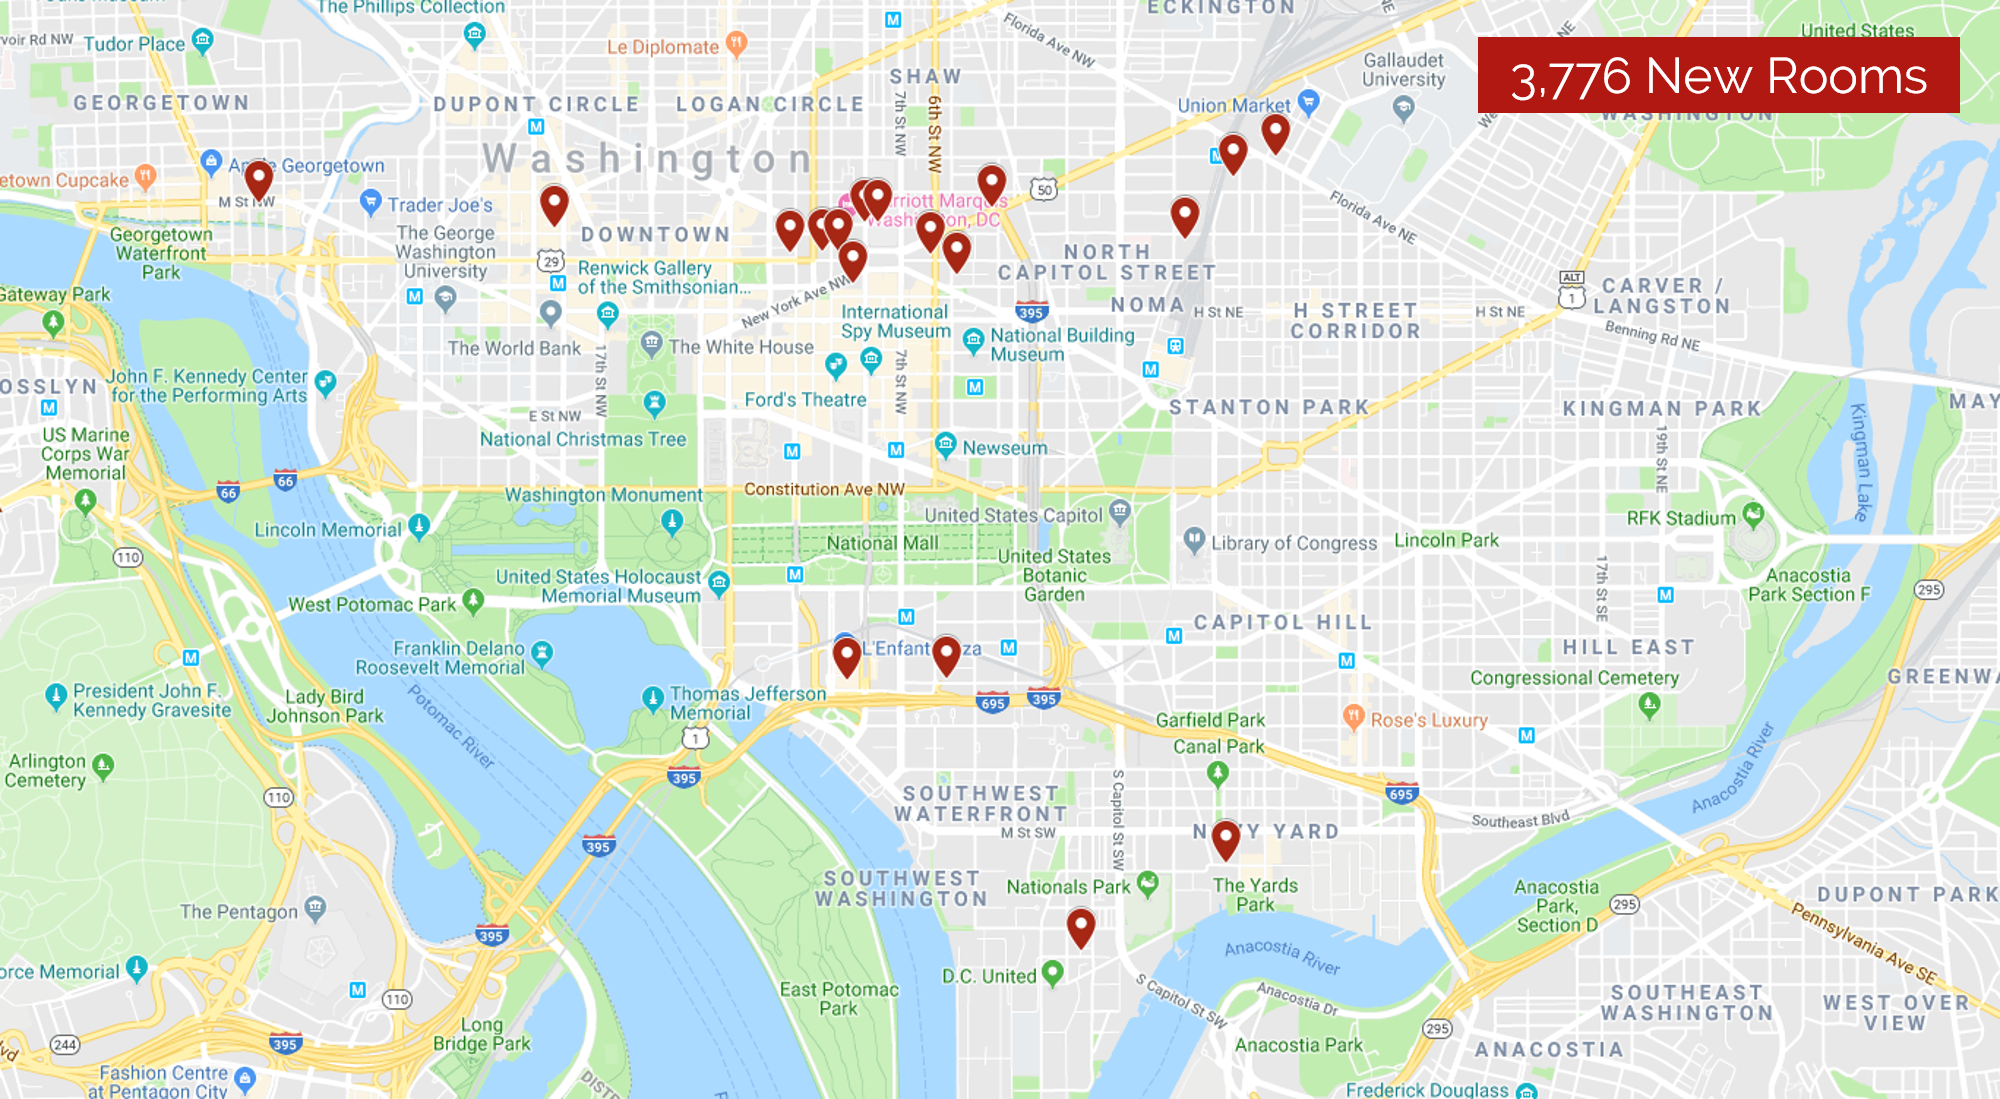
The following tables illustrate the anticipated new supply additions from 2018 through 2020, as well as the speculative additions to supply.
Map of Proposed Hotels
Map of Speculative Proposed Hotels
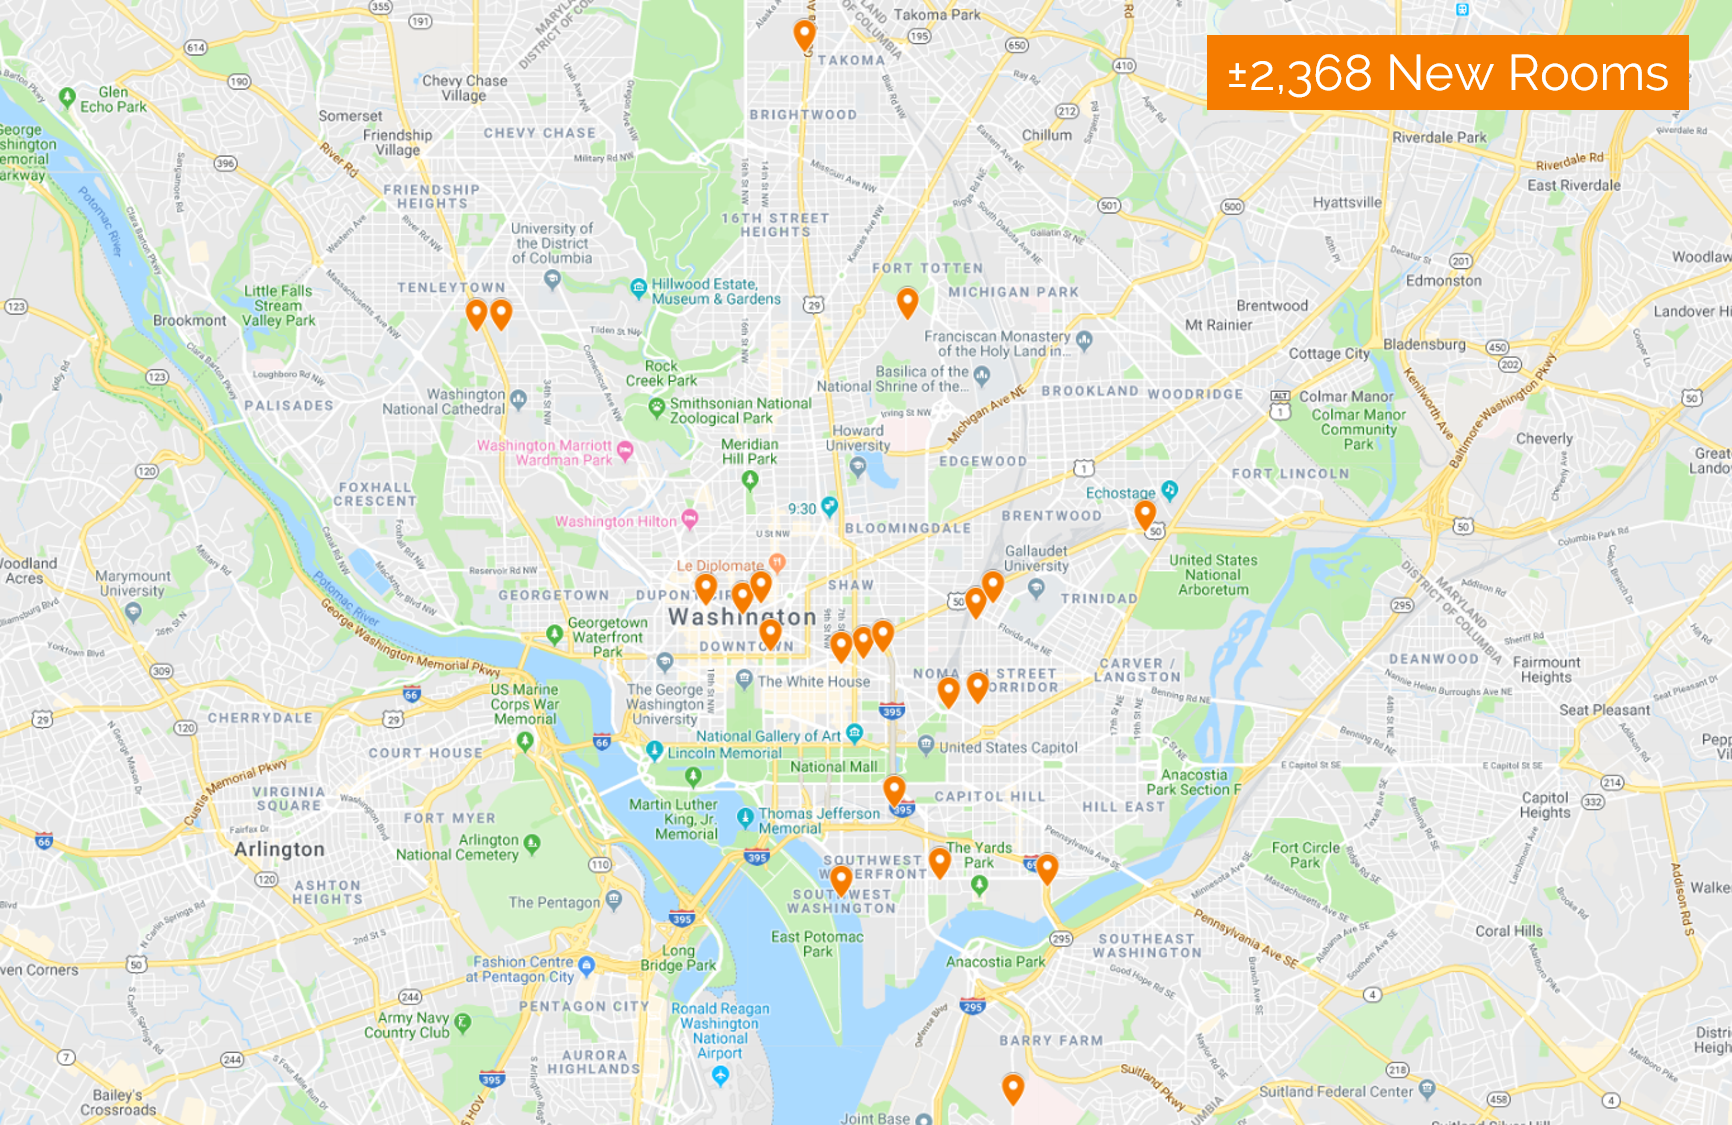
Source: HVS
Considering the market’s relatively stable occupancy and ADR historical trends, the influx of new supply is expected to have only a moderate influence on the market’s key performance metrics over the next several years. In 2018, over roughly 1,654 rooms entered the greater D.C. market area, and this pace of growth is anticipated to continue through 2020. In addition to the new development projects, rebranding and conversion projects are on the rise, which have the potential to change the hotel market dynamics in certain submarkets. While the advent of new supply is likely to constrain overall market-wide occupancy growth, much of the new supply and conversion projects within the District fall into the upper-upscale and luxury chain scales that typically operate at higher ADRs, which should help to mitigate declines in the overall market average; of course, individual submarkets and properties may be affected to a different degree, depending on the competitive landscape and market dynamics within each submarket.
Hotel Transactions
The D.C. lodging market’s stability has consistently captured the attention of investors worldwide. According to a 2018 report from the Association of Foreign Investors in Real Estate (AFIRE), Washington, D.C. remains a premier global real estate investment market and one of the top five U.S. cities because of its strong market fundamentals, stable tenant base, and significant barriers to entry; Washington D.C. was ranked 4th in the U.S. and 25th in the world, per AFIRE.
The following illustration reflects the number of transactions and the average price per room sold in the District since 1988.
Historical Transaction Counts and Average Price per Room
![]()
Source: Association of Foreign Investors in Real Estate (AFIRE)
Transaction activity over the past few years has demonstrated investor confidence in the market. The level of investor interest is also reflected in the capitalization rates indicated by the sales. Although capitalization rate data are not available for all transactions, the available data indicate cap rates ranging from 2.6% to 8.3% since 2015, with an average of 5.9%. The following table illustrates the most recent transactions in Washington, D.C.
Recent Transactions
![]()
Source: Association of Foreign Investors in Real Estate (AFIRE)
Given the limited available land and development constraints, including restrictions that limit building height in the District to 130 feet, coupled with high construction costs, Washington, D.C. has significant barriers to entry that are particularly favorable to investors with a long-term investment perspective. These attributes, along with the city’s role as the U.S. capital, have historically been attractive to investors, and particularly international buyers. Also attracted are competitive investors and developers looking to renovate, rebrand, or reposition existing hotels in the D.C. metro market. From a hotel investment perspective, the stabilizing presence of the federal government, strong tourism industry, improving convention segment, and expanding commercial base enhance the market’s appeal, although the pending increase in supply has given some cause for concern.
Forecast & Conclusion
Steady demand generated by D.C.’s collection of corporate, government, cultural, and educational institutions should further underpin positive hotel performance through year’s end. As such, the overall outlook is favorable for hotel investment and performance growth in the near term. The most common area of concern for the Washington, D.C. lodging market is related to the influx of new supply, which is anticipated to constrain occupancy growth in the near term. Additionally, ADR is expected to decline in 2018 and 2019 given the entrance of said supply, coupled with the most recent drop in the District’s federal per diem and the normalization of the inflated ADR from early 2017. Lastly, the potential for instability within the U.S. federal government and the overall health of the global economy also provide cautionary notes.
Historical and Forecast Occupancy and ADR for Washington, D.C.
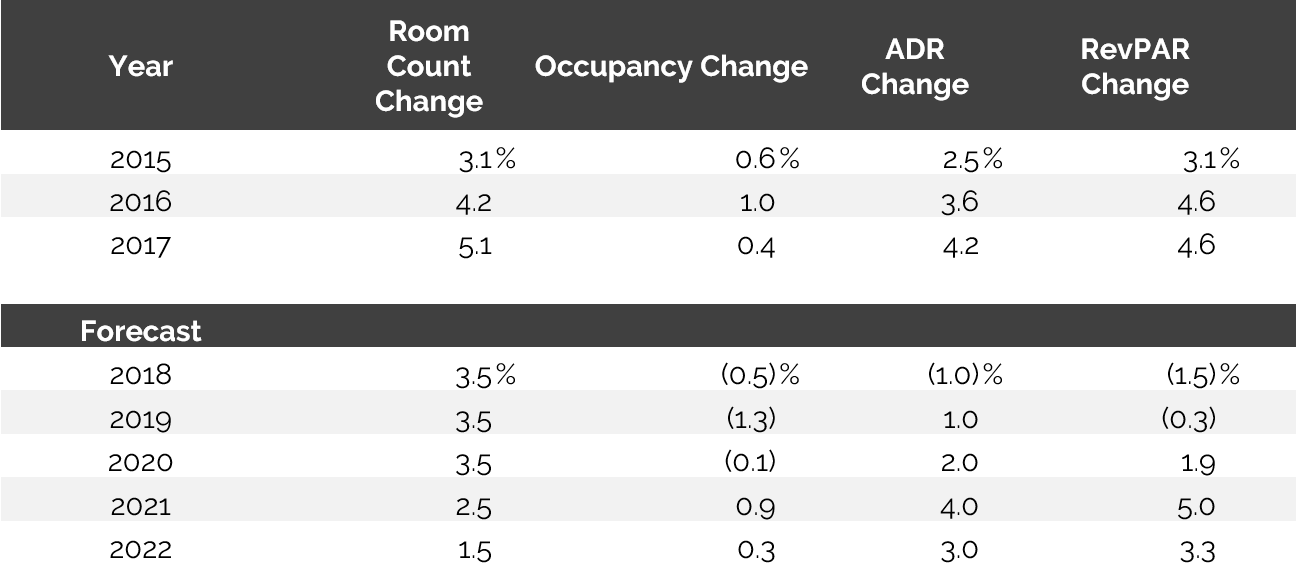
Source: HVS, STR
As the nation’s capital and the seat of the federal government, Washington, D.C. plays a unique role domestically, with one of the most fortified economies in the country. With strong corporate infrastructure, an array of educational and medical institutions, a highly educated base of young professionals, and numerous large-scale, transformational developments, Washington, D.C. remains a vibrant and growing metro, stimulating tremendous visitation and in-migration. Moreover, D.C.’s various tourism opportunities, including the Smithsonian Institute, the White House, and various historic sites, as well as its dynamic and evolving entertainment and dining offerings, all play a role in its status as one of the most desirable lodging markets in the country.
[1] https://www.bls.gov/regions/mid-atlantic/news-release/areaemployment_washingtondc.htm