By Robert Mandelbaum and Jamie Lane
Like other industries, profits in the hotel business are achieved when revenues exceed the cost of operations. In 2015, there are several factors that will enhance the ability of hotel managers to control their operating expenses:
According to Moody’s Analytics, the pace of inflation is forecast to be a mere 0.6 percent. This will help curb the growth in the cost of the goods and services purchased by hotels, including utilities.
In the March 2015 edition of Hotel Horizons®, PKF Hospitality Research (PKF-HR), a CBRE Company, is forecasting occupancy to increase by 1.9 percent in 2015. This is less than that 3.6 percent pace of occupancy growth reported STR, Inc. in 2014. A deceleration in the increase of occupied rooms leads to a slowdown in the growth of variable expenses.
While the national unemployment rate is declining, wage rates are still projected to grow at a relatively modest pace.
Therefore, with the expense side of the profit equation seemingly under control, what bottom-line contribution can hotel owners and operators expect from their top-line revenues?
Strong RevPAR Growth
As reported in the March 2015 edition of Hotel Horizons®, the growth in the demand for lodging accommodations in the U.S. will exceed the change in supply through 2016. For this year, rooms revenue per available room (RevPAR) is projected to increase by a very strong 7.3 percent. This is nearly twice the long-run average annual RevPAR growth rate of 3.2 percent as reported by STR, Inc.
The 7.3 percent RevPAR growth rate is the result of a forecast 1.9 percent increase in occupancy combined with a 5.3 percent rise in average daily rate (ADR). Therefore, 74 percent of the increase in RevPAR for the average U.S. hotel will be attributable to the rise in ADR.
To examine how the composition of the forecast RevPAR growth for 2015 will influence the change in net operating income (NOI) for U.S. hotels, we have analyzed the relationship between changes in RevPAR and NOI during 2013. The year 2013 was chosen because hotels operated in economic conditions similar to what is projected for 2015, and the composition of RevPAR change for the overall U.S. lodging industry that year was 76 percent driven by the change in ADR.
The data for our analysis came from a sample of 3,867 operating statements for the year 2013 pulled from PKF-HR’s Trends® in the Hotel Industry database. For the purpose of this analysis, NOI is defined as income before deductions for capital reserve, rent, interest, income taxes, depreciation, and amortization.
The Thumb Rule
Previous research conducted by PKF-HR has found that changes in ADR have had an influence on changes in NOI two to three times greater than the change in occupancy. Intuitively this makes sense given the variable expenses associated with servicing the incremental number of occupied rooms. In 2013, however, we observed a different pattern.
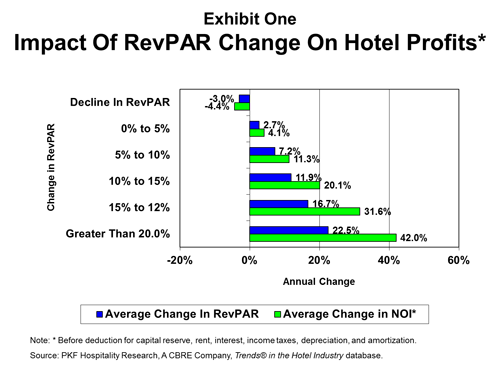
0n average, the properties in our sample achieved a RevPAR change of 6.1 percent from 2012 to 2013. This was the result of a 1.8 rise in occupancy, along with a 4.3 increase in ADR. For this sample, ADR growth contributed 70 percent towards the increase in RevPAR. On the bottom-line, NOI for the sample increased by 10.0 percent. As expected, there was a direct correlation between the change in RevPAR, and the change in NOI. Those hotels with the greatest gains in RevPAR achieved the strongest growth in NOI (see Exhibit One).
Econometrically, we estimated an equation to explain the change in NOI from changes in occupancy and ADR. The equation below shows that the influence of the changes in occupancy resulted in a coefficient of 1.9, while the changes in ADR lead to a coefficient of 1.8. The closeness of the coefficients can be interpreted as an indication that the influences of changes in both occupancy and ADR on movements in NOI are almost equivalent.
NOI Change = 0.01 + 1.9*(Occupancy Change) + 1.8*(ADR Change)
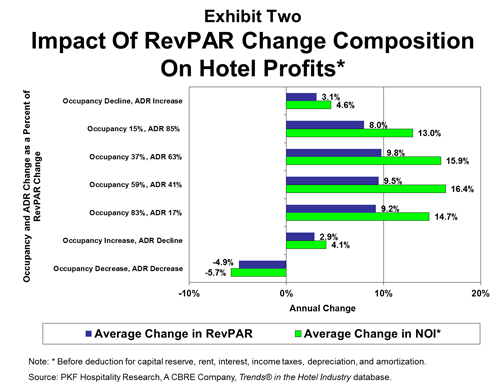
When stratifying the sample based on the contribution mix of occupancy and ADR growth, we find similar results. In all four categories where the hotels achieved increases in both occupancy and ADR, the average NOI growth rate for the groups fell in the tight range of 13.0 percent to 16.4 percent (see Exhibit Two). On average, NOI growth of less than 5.0 percent was achieved by hotels when either occupancy or ADR declined. When both metrics declined, the average property suffered a 5.7 percent decline in NOI.
Implications For 2015 and Beyond
Given the low inflationary environment projected for 2015 and the near future, the influence of occupancy on expense growth appears to be muted relative to the past. Therefore, the historical boost to the bottom-line typically received from ADR driven RevPAR will not as great as it used to be.
That being said, increases in both occupancy and ADR will drive RevPAR in 2015 and 2016. The resulting strong increases in revenue, combined with tempered growth in operating expenses, will result in double-digit gains in NOI for the next two years.
During the recent lodging cycle from 2007 to present, we have observed several performance patterns that have differed from historical lodging industry precedence. For the next few years, the RevPAR thumb rule appears to be on-hold.