By Max Starkov
The year of 2016 will be the first in which OTA revenues in the U.S. will surpass brand.com revenues in hospitality. The OTA vs. brand.com (direct online channel) ratio will dip to 51:49, compared to 46:54 back in 2012 (PhoCusWright). Hospitality is the ONLY travel sector in which the OTAs are gaining share at the expense of brand.com; direct online revenues from the airline, car rental and cruise sectors are all increasing at the expense of the OTAs in 2016.
In addition, the above hospitality sector average is heavily skewed by the major hotel brands. For independent hotels – where the OTAs already control over 60% of online bookings, I would not be surprised if the OTA share increases to 70% in the next few years.
This trend isn’t promising. With the recent addition of new OTA-type services such as “Book on TripAdvisor” and “Book on Google,” brand.com vs. OTA ratios will likely shift even further into negative territory.
In my view, one of the main reasons for why hospitality has allowed and continues to allow the OTAs to triumph over brand.com and to keep increasing their market share is the way the industry accounts for distribution costs from the OTA vs. the direct online channels.
How Do We Account for OTA Distribution Costs?
Mike Harris, an industry veteran and VP of Ledgestone Hospitality, explains the current situation in very simple terms: “Currently our industry measures the average price per rented room, the number of rooms we rent compared to how many we have, and the revenue generated per room at the property. But NOWHERE do we measure how much each booking is actually worth.”
The typical industrywide operating benchmarks used to measure a property success are ADR (average daily rate), Occupancy Rate and RevPAR (revenue per available room). These benchmarks are used for the weekly property “flash” reports, and have become the basis for many operational decisions, including staffing levels, budgets, staff compensations and management bonuses.
So how does the industry measure the cost of distribution from the OTA channel?
- Merchant Commissions: when the OTAs use the merchant model (Ex. Expedia), they collect the room revenue booked from the consumers and pay the hotel their negotiated net rate. In this case, these merchant commissions are not even accounted in the hotel P&L.
- Agency Commissions: agency commissions paid to OTAs (Ex. Booking.com; Expedia’s agency model, etc.) are accounted for in the property’s financial statement as COGS (Cost of Goods Sold) in a single line item titled "travel agent commissions," with no differentiation from brick-and-mortar travel agents’ commissions. Unless there are significant YoY deviations, most owners and managers do not even review the composition of this line item, and whether these commissions are paid for GDS, CRS or OTA bookings. It is, what it is; and it's accepted as a cost of doing business.
In other words, currently the OTA distribution costs are being completely ignored, while top line benchmarks such as ADR, RevPAR and Occupancy are subject to rigorous reviews and become the basis to measure success.
Example:
In Q1 2016, if your 100-room independent property’s main benchmarks were: ADR $150, Occupancy Rate 70% and RevPAR $105, and you are 5% up YoY, the property is doing great, correct? But what if 65% of roomnights were generated by the OTAs and only 5% from brand.com? Who is responsible for “wasting” over $450,000 in OTA commissions, a huge amount that should have gone directly to the bottom line? Since the cost of distribution or profit per available room are not used as benchmarks, this highly negative distribution scenario to the overall “property health” would not matter and would not be taken into account.
Furthermore, there is no cap or limit to OTA distribution costs! With a merchant commission model, OTA distribution costs are not even included in room revenue. And with an agency OTA commission model, commissions are deducted as COGS from gross room revenue before NOI (Net Operating Income) is calculated. This “unlimited commission potential” allows OTA bookings to grow exponentially without being restrained by the property budget, which as we will see below, isn’t the case with direct online bookings.
The damage of the unlimited OTA commission gets multiplied by the Last Room Availability (LRA) provision the OTAs won from hotels during the recession.
How Do We Account for Distribution Costs from Brand.com/Direct Online Channel?
All the distribution costs via brand.com, including ongoing website technology upgrades and content optimization, dynamic content personalization, reservation abandonment programs, hosting, SEO, paid search, online media and retargeting, first-party and real-time data marketing, email marketing, social media engagements, consulting, etc., come from the Sales & Marketing Budget, which is a line item in the property budget.
Brand.com distribution costs are severely limited by the Sales & Marketing Budget line item in the property budget, and irrespective of how profitable the direct online channel is, the property cannot or rarely can spend more money to get more direct bookings and shift share from the OTAs who have none of these restrictions.
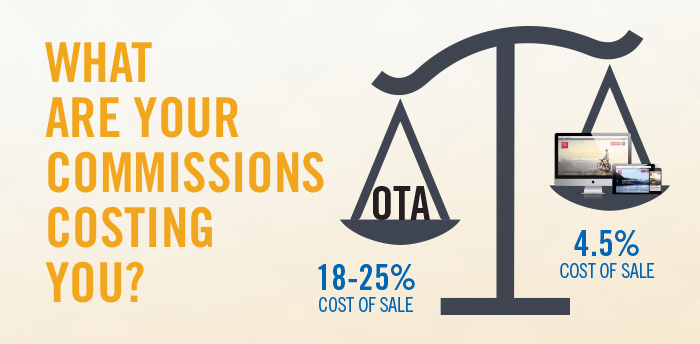
Across the HeBS Digital hotel client portfolio, the average brand.com distribution costs were 4.5% in 2015. Compare this to the hefty OTA commissions of 18%-25%. Yet, we have had many cases with our hotel clients when a multi-channel campaign or a digital marketing initiative is performing exceptionally well with ROIs of 1500% – 2500% and up (which equals to distribution cost of 4%-6.6%), and yet the property cannot allocate more funds to the campaign/initiative due to budget limitations, in spite of the fact that they need the business badly.
So it is extremely ironic that the most cost-effective bookings – from the direct online channel, are severely restricted by the property’s sales and marketing budget, while the most expensive bookings – from the OTAs with cost of distribution of 20% plus — are not restricted and can grow exponentially.
Why is this happening? Why is the industry shooting itself in the foot?
Mike Harris explains this very eloquently: “Why do we blindly repeat bad distribution, operational and financial decisions that are harmful to our profits? The industry is like an addict: Peer Pressure (comp set are fully engaged with the OTA's); Habit (industry got hooked after 9/11 and several consecutive recessions); Conditioning (we know the OTA channel produces and it's easily quantifiable), Denial (refuse to believe there is a better way), Misinformation or Lack of Education (when you don't know, you don't know).”
Add to the above the defeatist mentality and acceptance of the status quo at many properties and hotel companies, and it is easy to understand why OTAs are increasing their market share even in these booming times for the hospitality industry.
No doubt, the current situation is a huge “self-inflicted wound” our industry has been tolerating for far too long! So what is the solution to this conundrum?
How to Heal Hospitality’s Self-Inflicted Wound, Fast?
I believe the following action steps will not only remedy the current situation, but will provide a huge impetus to boosting direct online channel and shifting share from the OTAs:
- The industry should adopt an overarching bottom line benchmark: Profit per Available Room (ProPAR) that trumps all of the accepted and widely-used top-line benchmarks such as ADR, Occupancy Rate and RevPAR. ProPAR will introduce an unparalleled distribution channel transparency about the cost to acquire each booking, and will allow owners and managers to focus on and prioritize the most efficient and cost-effective distribution channel – the direct online channel, and introduce sufficient funding for the brand.com marketing efforts as well as incentivize employees responsible for the brand.com production. ProPAR is not a new concept, but it is time to move this benchmark from its status as an exotic and somewhat theoretical point of reference into the primary industry benchmark to measure the property’s success.
- Cost of distribution via brand.com should be treated in exactly the same manner as OTA commissions i.e. as COGS and deducted from the gross room revenue before NOI is calculated, including ongoing website technology upgrades and content optimization, dynamic content personalization, reservation abandonment programs, hosting, SEO, paid search, online media and retargeting, first-party and real-time data marketing, email marketing, social media engagements, consulting, etc. Recognizing brand.com distribution costs as COGS will unleash the property’s ability to adequately fund the direct online channel efforts, boost bookings via the property website and drastically decrease OTA dependency. Lowering overall distribution costs will allow the property to fund renovations and product/services improvements, invest in human resources, and add a hefty chunk to the bottom line.
- Adopt a “Direct is Better” top-down corporate strategy, with the primary goal of generating more direct online bookings. Without such a strategy, the property ends up with under-staffed and under-budgeted direct online marketing efforts, bandwidth and focus. Determine who at the property “owns” the website and its results and performance; whose employee salaries and bonuses will be determined by the website’s revenue and brand.com distribution costs, who is to be incentivized when the market share needle is moved from OTAs to direct online bookings. When the property embraces a “direct is better” top-down strategy and the on-property team sets a primary goal of generating as many bookings as possible via the direct online channel – by far the most profitable channel today – the team can work together to seize market share from the OTAs as a united front. You may read more about what should be included in the property’s comprehensive “Direct is Better” strategy in my recent article on the subject “Hotelier’s Action Plan to Win Back Market Share from the OTAs.”
Conclusion
Hoteliers, the time for complacency is over. The recession is long gone and we have been enjoying a healthy hospitality economy for the past four years. What is missing in this post-recovery period is the hotelier’s focus and drive to increase bottom-line profits by shifting share from the OTAs to the direct online channel. I really hope the recent “Book Direct” initiatives by the major hotel brands will excite the whole industry and help swing the pendulum back.
We implore you to heal hospitality industry’s “self-inflicted wound” and make the direct online channel the main focus of your property’s and hotel company’s core corporate strategy by 1) Adopting ProPAR as the primary success-measuring benchmark in the industry; 2) Starting to treat brand.com distribution costs in exactly the same manner as OTA commissions i.e. as COGS, and start deducting brand.com distribution costs from the gross room revenue before NOI is calculated, and 3) Adopting a top-down “Direct is Better” strategy and organizational goal of generating more bookings from the direct online channel.