Erich Baum
Openings of hotels with 700+ rooms are rare events in even the most first-tier urban locations. Such openings are usually associated with the operations of a major convention center. These properties are typically referred to as headquarters hotels due to their unique capacity to function as the primary lodging option for large citywide conventions. This article looks back at nine headquarters hotel openings over the past 16 years as a means of illuminating the rate at which such hotels are absorbed and examining the impact such properties have had on their competitive sets. (The competitive sets were defined by HVS in the course of fieldwork and include only those hotels that qualify as primary and secondary competitors.)
Statistical Summary The following table details basic data associated with the nine headquarters hotels studied herein. Each property opened in a first- or second-tier U.S. city, in the immediate vicinity of a major convention center.
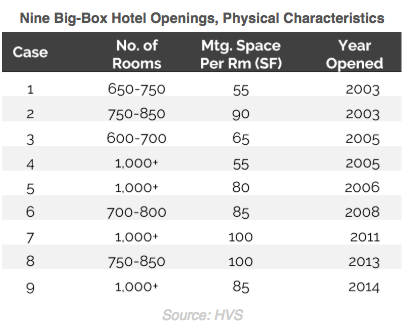
The nine properties contained allocations of meeting space ranging from approximately 55 to 100 square feet per guestroom, or an average of approximately 80 square feet per guestroom. For a 1,000-room hotel, the meeting space allotment would equate to approximately 80,000 square feet.
The following table summarizes the impacts on supply, demand, and occupancy over the four-year period bracketing the property’s opening and third year of operation. The first year represents the year prior to each headquarters hotel’s opening.
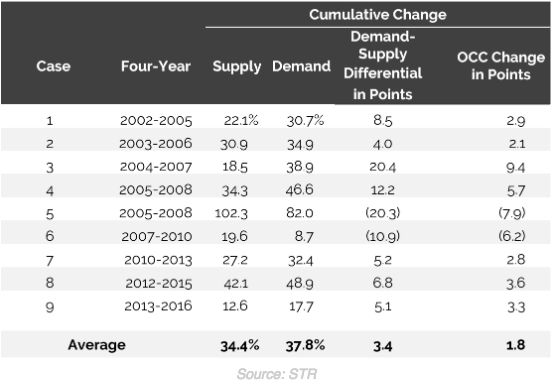
Among the nine case examples, the new headquarters hotels increased their competitive sets’ supply level by 12.6% to 102.3%, or an average of 34.4%. Changes in the level of occupied room nights (“demand”) over the same period ranged from 8.7% to 82.0%, averaging 37.8%. The differential between the supply and demand levels ranged from negative 20.3 to positive 20.4 points. In only two cases did the rate of supply growth exceed the rate of demand growth. On average, demand grew faster than supply by 3.4 percentage points (i.e., 340 basis points faster). In the two cases where the competitive set’s occupancy rate declined, the historical period was affected by the 2008/09 recession. The other seven competitive sets recorded occupancy rate growth ranging from 2.1 to 9.4 points. The average occupancy gain for the nine case examples was 1.8 percentage points.
The following table summarizes the average annual percentage change in occupancy, average daily rate (ADR), and rooms revenue per available room (RevPAR) over the four-year span before and after the new hotel’s opening. RevPAR is the product of occupancy and average rate and serves as the best single measure of performance.
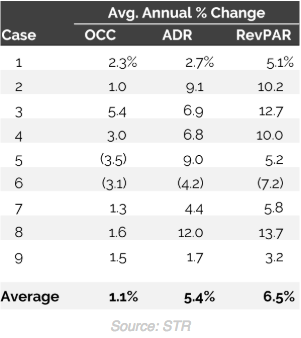
Whereas changes in occupancy were addressed above, the preceding table is useful in illustrating the effects on average rate. Average rate declined in only one of the nine cases, again reflecting the impact of the 2008/09 recession. Among the remaining eight cases, one competitive set posted below-inflation growth, another was basically at inflation, and the remaining six posted above-inflation pricing gains. The average annual three-year compounded growth rate across the nine case examples averaged 5.4%. Adding the impact of the gains in occupancy, the average annual three-year compounded growth rate for the nine case examples’ RevPAR averaged 6.5%.
Supply-Induced Demand In eight of the nine cases, the competitive sets thrived despite the introduction of a major influx of new inventory. In all nine cases, demand grew rapidly in response to the new inventory, illustrating a dynamic referred to as “supply-induced” demand. When hotel inventory is added, supply-induced demand is realized when demand growth coinciding with the hotel’s opening exceeds base growth in the local economy. Conditions that can support the realization of supply-induced demand include the following:
- Often the nearby convention center’s potential to generate hotel room-night demand has been limited historically because of insufficient hotel rooms within walking distance. The opening of a headquarters hotel gives convention center management the inventory it needs to market the facilities.
- As with each of the nine case examples, the new hotel is typically managed by a nationally recognized and highly esteemed full-service brand (e.g., Hilton, Marriott, Omni, Hyatt Regency, Westin, InterContinental, etc.). The brand’s incremental marketing program efforts help activate both latent and new demand sources.
- The new hotel often features a large allotment of meeting space, allowing hotel management to attract and accommodate large groups in-house. As noted above for the nine case examples, in-house meeting space averaged approximately 80 square feet per room, or 80,000 total square feet for a 1,000-room hotel.
Conclusion Conditions that support the construction of a new headquarters hotel are relatively rare, and the opening of such a hotel typically occurs after a lengthy period of debate, requiring cooperation between public and private entities. Government-provided subsidies and other financial incentives are also frequently required. The economic stakes are among the highest a city’s development agencies and elected officials can face, requiring an intensive study of the project’s economic prospects. The findings presented here suggest that the market research has been performed ably. The case examples’ success rate was high. A RevPAR loss was recorded by only one of the nine competitive sets reviewed, and that loss was at least partially attributable to the 2008/09 recession.