
advertisement
Select Your Profits
A Comparison of Select-Service Versus Full-Service Performance
|
News for the Hospitality Executive |
advertisement
Select Your Profits
|
By
Robert Mandelbaum
March 19, 2013 The definition of “select-service” within the lodging industry may vary from person to person, but there is no doubt that properties in this segment are the most popular among developers. Using the broadest definition of select-service, this category comprised an estimated 85 percent of the total projects in the development pipeline according to the October 2012 U.S. Hotel Pipeline Outlook report from Smith Travel Research. While developers may be influenced by emotional and other non-economic factors, financial return is typically the main criteria considered when choosing to develop one type of hotel versus another. To gain a better understanding of the financial performance of select-service hotels, we compared and contrasted the operating performance of select-service and full-service hotels. From the PKF Hospitality Research, LLC (PKF-HR) Trends® in the Hotel Industry database we pulled a sample of 319 select-service properties for which we had data each year from 2005 through 2011. For comparison, we identified a same-store sample of 79 “traditional” full-service hotels that operate under a brand within the same parent companies represented in the select-service sample. Resort and large convention hotels were excluded from the full-service cohort. In general, select-service properties offer a limited degree of food and beverage alternatives compared to traditional full-service hotels. In some circumstances, this definition will include limited-service, extended-stay, and all-suite hotels which offer only complimentary food and beverage service. However, for the purpose of our analysis, the select-service sample consisted solely of hotels that offer some, albeit limited, amount of regular non-complimentary food and beverage service. On average, the select-service sample averaged 154 rooms is size, with an average occupancy of 67.5 percent and an average daily rate (ADR) of $111.11 in 2011. For these properties, food and beverage revenue comprised 7.4 percent of total revenue for the year. The full-service sample averaged 334 rooms, 69.1 percent occupancy, and an ADR of $142.15. Food and beverage sales at these hotels made up 28.8 percent of total hotel revenue. 
As expected, the select-service sample consistently achieved higher profit margins compared to the full-service hotels. From 2005 through 2011, net operating income (NOI) measured as a percent of total revenue averaged 36.4 percent at the select-service hotels and 25.7 percent at the full-service properties. Net operating income (profit) is defined as income before deductions for capital reserve, rent, interest, income taxes, depreciation, and amortization. The mathematical influence of the low contribution margins achieved in hotel food and beverage departments is the primary reason for the lower overall profit margins experienced at full-service properties. However, it should be noted that the full-service hotels in our study sample were able to achieve a higher food and beverage department profit margin (26.5%) compared to the select-service properties (12.1%). The greater volumes of more profitable banquet and beverage sales at the full-service hotels explain this difference. Labor costs are the largest expense at hotels and an area that requires significant attention from management. For hotel owners and operators seeking less stress, the reduced levels of staffing at select-service hotels are attractive. In 2011, the combined cost of salaries, wages, and benefits at the select-service hotels averaged 43.4 percent of revenue, or $13,112 per available room (PAR). On the other hand, full-service labor costs were $26,034, or 50.9 percent of total revenue. The lower levels of labor also contribute to the higher profit margins at select-service hotels. Volatility Over the seven year period studied, the select-service and full-service hotels performed comparably. As of year-end 2011, the NOIs for both the select- and full-service properties were down approximately 3.3 percent from the profit levels they achieved in 2005. However, when analyzing the year-by-year changes in NOI, we find slightly more volatility in the performance of the select-service sample. 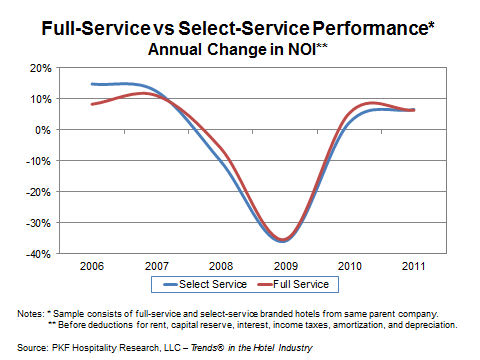 This year-by-year analysis of changes in NOI indicates that select-service hotels have been better equipped to capitalize on favorable market conditions, but suffer more during depressed periods of performance. The Dollar Difference Select-service NOI margins are greater than those at full-service hotels, but the average full-service property achieves greater levels of profit. In 2011 the average select-service hotel in our sample averaged an NOI of $9,561 PAR. This compares to $12,525 PAR in profits at the full-service hotels. 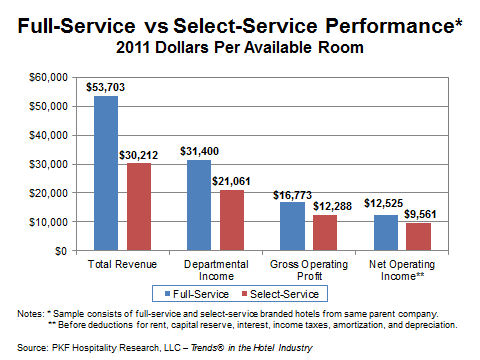 Select-service hotels have proven to be very profitable. During prosperous times these properties are very efficient at transforming top-line dollars to bottom-line profits. That being said, select-service feasibility is not always guaranteed. During the recession select-service hotels showed they are a bit more vulnerable to declines in profits. PKF-HR advises it clients to examine all the local market and financial factors that impact the property type selection process.  Robert Mandelbaum is Director of Research Information Services for PKF Hospitality Research, LLC (www.pkfc.com). He works in the firm's Atlanta office. To purchase a copy of Trends® in the Hotel Industry, please visit www.pkfc.com/store. This article was published in the February 2013 edition of Lodging. |
| Contact:
Robert Mandelbaum |