
advertisement
.
|
News for the Hospitality Executive |
|
A Methodology for Analyzing Lodging Property Operating Cost Structures |
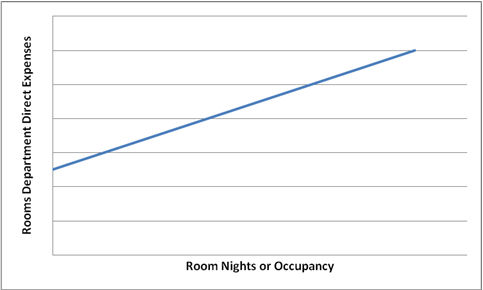
| by Jason Bass, CFA June 2011 The persistently weak economy has forced many lodging property owners to set their valuation and profitability objectives completely aside to focus all efforts on simply maintaining property viability. A combination of low valuations, apathetic equity markets, stagnant debt markets and weak consumer demand has severely compromised, and continues to weigh heavily on, the lodging sector’s financial health. The delay and outright failure by some property owners and their management teams to adequately reduce fixed operating costs in response to the “Great Recession” has contributed to recent high rates of foreclosure and the distressed sale of assets. While those who have responded to the economic crisis by restructuring debt, repositioning and/or improving efficiencies to better variabalize their operating models stand not only to survive these difficult times but also to potentially take advantage of emerging opportunities as the nascent recovery continues to gain traction. The severe and rapid change in the lodging market landscape from its latest boom period of the mid 2000s to its current anemic condition provides a compelling financial analysis opportunity. Specifically, the opportunity to conduct highly robust quantitative analyses of the levels and trends in the fixed-variable cost structures of lodging properties to evaluate period-specific and overall expense management during the most recent economic cycle. Analysts frequently apply erroneous rule-of-thumb assumptions regarding the breakdown of operating expenses between their fixed and variable components in evaluating relative profitability or in budget planning for specific properties. Many also misinterpret the fixed versus variable expense indications of historical property-specific financial data by making ad-hoc line-item by line-item assumptions as to the categories of expenses that are fixed or variable. That this is the case is somewhat surprising as standard statistical analysis methods, specifically linear regression, can be used to derive unbiased estimates of the levels and trends in property operating cost structures based on historical utilization and income statement data. Such statistical methods are not only useful to property owners and managers seeking to evaluate expense management and more accurately budget for the cost implications of demand shifts in future periods. They are also an extremely valuable tool for experts seeking to estimate the operating expenses associated with foregone revenues in lost profit calculations for breach of contract, construction defect, business interruption and other litigation matters. A profound weakness of many lost profit analyses are unjustified and/or indefensible assumptions on incremental operating expenses despite credible assessments of lost revenues. Linear regression is an excellent tool for modeling the fixed-variable cost profile of a lodging property. As an example, the analysis objective may be to break down the total direct operating expenses of a hotel’s rooms department between its fixed and variable components. In this instance, the department’s fixed expenses would be some base level of expenditures associated with housekeeping and the department’s other activities that are incurred irrespective of the level of occupancy. While the department’s variable expenses might be presumed a direct function of realized occupancy (either in terms of percentage occupancy or room nights sold). In regression analysis parlance, the model is framed on the reasonable premise that the variability in the rooms department’s operating expenses can be explained largely by the variability in the hotel’s occupancy. (Accordingly, the substantial inter-year variation in recent occupancies due to the economic downturn provides good data to evaluate the associated variability of operating expenses and more effectively discern between the fixed and variable components of those expenses applying tried and true statistical methods). This regression model takes the linear form introduced in high school algebra of y=mx+b. For the rooms department example above, y would represent total rooms department operating expenses for a given period (a year, month, etc.). Y is then set as a function of the incremental operating expenses incurred per room night sold or percentage point of occupancy (m) times occupancy (x) plus the fixed expenses incurred by the department (b). The coefficients m (variable expenses) and b (fixed expenses) can be estimated with regression techniques using a time series of historical data for the hotel’s occupancy and corresponding rooms department operating expenses. Figure 1 illustrates the linear regression function graphically. In the figure, the rooms department’s estimated fixed expenses (b) are indicated by where the blue line intersects the vertical axis. This is the estimated minimum amount of operating expenses that would be incurred by the hotel’s rooms department even if occupancy was zero. These expenses may include the housekeeping manager’s salary, as an example. Moving from left to right in the figure, as occupancy increases, the hotel will incur additional associated operating expenses (variable expenses) which are captured by the upward slope of the line (m). These expenses result from incremental expenditures on housekeeper wages, laundry, bath products, etc as the number of room nights sold increases. Figure
1
 In
reality, a hotel’s variable operating expenses are unlikely to be
perfectly correlated
with occupancy as depicted in the figure. For example, the cost of
housekeeper
wages, which is an important line-item component of direct rooms
department
expenses, may not increase at a constant rate relative to occupancy,
particularly when union-related or other employee contract restrictions
limit staffing
flexibility. One housekeeper may be able
to clean a specific number of rooms per shift. When occupancy increases
beyond
that number of rooms a second housekeeper has to be brought in for part
or all
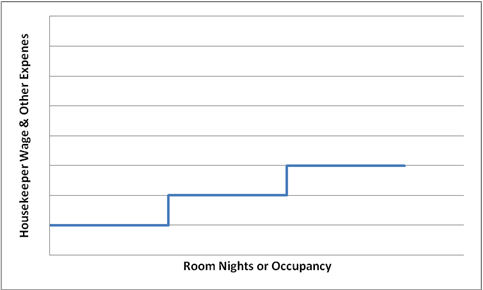
of a shift and so on. Therefore, the true model of
housekeeper-associated wage expenses
for a property may be more of a step function that increases each time
the property
reaches a new occupancy threshold. This is illustrated in Figure 2
below.
Figure
2
 Thus, applying the linear
functional form (y=mx+b) to model a hotel’s cost structure is
fundamentally a
simplification, particularly when analyzing very specific labor-related
line-item expenses such as housekeeper wages. Be that as it may, most
lodging
operations employ a relatively large number of housekeepers at any one
time. Accordingly, occupancy-related
changes in the number of housekeepers may have a relatively small
incremental
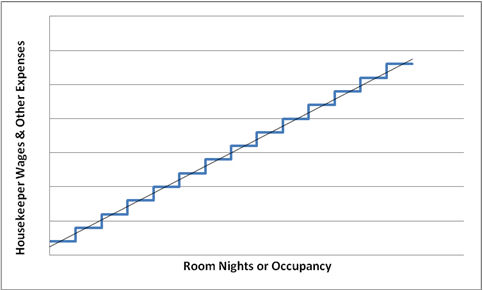
impact on a hotel’s overall housekeeper wage expenses. Figure 3
below illustrates this point; that linear
approximation, though not perfect, is in most cases sufficiently
accurate. Furthermore, the model’s accuracy improves
further when evaluating aggregations of expenses, such as those for the
overall
rooms departments, since many of the line-item components that comprise
those
aggregations are relatively linear and those that are more stepwise,
such as
housekeeper wages, tend to somewhat cancel each other out.
Accordingly, it has been this author’s
experience that linear regression provides an accurate tool for
breaking down
the fixed-variable cost profile of lodging properties, particularly for
major
expense line-items such as departmental direct expenses, administrative
and
general expenses, and sales and marketing expenses, to name a
few. The same techniques can also be applied to
other departments such as food & beverage and spa, though the
appropriate
utilization metrics to use for those analyses may differ.
Figure 3
 To demonstrate the application of
linear regression to hotel fixed-variable cost estimating, Table 1
presents fabricated
utilization and rooms department operating expense data for a
hypothetical 220
key hotel over a twenty-four month period, January 2008 through
December 2009. Monthly utilization, revenue and expense data
is preferred over annual data when examining a lodging property’s
period-specific fixed-variable cost profile, though annual data can
also be
used effectively. The benefit of using
monthly data includes that fewer years of data are needed to produce a
sample
size large enough for statistically relevant estimates of fixed and
variable
costs. Also, monthly data tends to show
greater inter-period volatility than does yearly data, providing a more
robust
basis for regression estimation. And finally, a shorter time period of
analysis
reduces concerns for the potentially distorting influence of inflation
on the results. Normalizing for inflation in the data is
critical if the assessment is to produce accurate estimates,
particularly for a
time series of data that covers a relatively large number of
years.
Accordingly, to be accurate, the application
of regression analysis does require an assessment of the historical
changes in
cost for labor and non-labor inputs and adjustment of the data
accordingly. The one important caution with monthly income
statement data is that certain expenses may be artificially distributed
across
months or may be reported in months other than when they are incurred,
affecting the model estimates.
The data in Table 1 is assumed to have already been adjusted for inflation to 2009 dollar terms.
Figure 4
 The results of a regression of
the hypothetical hotel’s rooms department operating expenses on room
nights
sold are summarized in Table 2.
Per the table, the estimated variable for the rooms department is $29 per room night sold. The estimated average fixed cost each month incurred by the department is about $140,000. The table also shows the hotel’s monthly fixed and variable costs predicted by the model results at several occupancy levels. For example, at 70 percent occupancy in a given month, it is projected that the hotel’s rooms department will incur $140,000 of fixed costs and almost $136,000 of variable costs (total costs of about $276,000) in that month. This translates to predicted costs that are 51 percent fixed and 49 percent variable at that occupancy level. Were the purpose of the analysis, for example, to determine the impacts on the hotel’s bottom line of a 10 percent loss of occupancy due to business interruption (in a litigation matter), the regression results could be used to accurately assess the associated variable cost savings by the rooms department due to that loss of business. The cost savings estimate could then be applied in the calculation of net lost profits.
Figure 5 compares the actual
monthly rooms department operating expenses for the hotel during the
period of
study as shown in Table 1 to the estimated monthly rooms department
operating
expenses based on the regression analysis results. Though not
perfect the two track very closely
and provide further support for the use of the regression results as a
reasonable basis to estimate the fixed versus variable components of
the
hotel’s rooms department operating costs at different occupancy levels.
Figure 5
 In conclusion,
linear regression is a very useful tool for evaluating the levels and
trends in
cost structures within the lodging sector.
Great care, however, should always be taken in using regression
analysis. The quality of the data must be
validated a priori and caution must be taken in the interpretation of
regression results, most notably statistics on variance, model goodness
of fit
and the significance of the derived estimates of m (variable cost
coefficient)
and b (fixed cost coefficient).
Authored by Jason Bass, CFA @ [email protected], 602-430-2485 Jason is a financial and economic analyst who specializes in lodging and mixed use development, operations and management issues. Thanks to Maurice Robinson, President of Maurice Robinson & Associates and Alain Longatte, President of Resort Advisory Group International for their editorial review of this article. |
||||||||||||||||||||||||||||||||||||||||||||||||||||||||||||||||||||||||||||||||||||||||||||||||||||||||||||||||||||||||||||||||||||||||||||||||||||||||||||||||||||||||||||||||||||||||||||||||||||||||||
| Contact:
Jason Bass, CFA |