
.
New Data!
Mining A Hotel�s Operating Statement
|
News for the Hospitality Executive |
.
New Data!
Mining A Hotel�s Operating Statement
| by: Robert Mandelbaum, November 2008
When preparing the first edition of the Uniform System of Accounts for Hotels in 1926, the Hotel Association of New York City set out to establish a uniform �responsibility accounting system� for the lodging industry. This dictum recognizes that one of the main purposes of the hotel operating statement is to provide a logical presentation of hotel revenues and expenses that enables management to act upon the interpretation of the data. To serve as an effective management tool, the operating statement should present the revenues and expenses that are most critical to the operation of the subject hotel. In-depth tracking of complimentary breakfast expenses is important for management at a limited-service hotel, while expansive resorts will have detailed sub-schedules for their golf and spa operations. The evolution of the lodging industry also influences the data presented in a hotel operating statement. Ice (for refrigeration) could be found as a prominent expense item in the food and beverage department during the early 20th century. Recently, in preparation of the 10th edition of the Uniform System of Accounts for the Lodging Industry (USALI), accommodation was made for contemporary items such as internet revenue and e-commerce expenses. For the past 72 years, PKF Consulting has been collecting and processing hotel operating statistics for our annual Trends in the Hotel Industry report. Like the USALI, we routinely update the financial benchmarking data captured in our database based on input from our clients and the readers of our reports. For our 2008 Trends in the Hotel Industry survey, PKF Consulting has added several new revenue and expense items. In the following paragraphs, we present some of these new statistics that reflect recent operating trends, as well as current accounting standards. F&B Revenue Sources To provide our clients with a better understanding of the sources of their food and beverage revenue, our Trends database now tracks sales for five different categories: restaurants, lounges, room service, mini-bar, and banquet. The revenue for each outlet is further delineated by food versus beverage. In 2007, the banquet department contributed the greatest revenue among all food and beverage outlets for the full-service hotels in the Trends database. Banquet revenues comprised 38.9 percent of total department revenue, followed by restaurants (31.4 percent). Because of the extent of banquet activity at the properties in our sample, it is interesting to note that room service and banquet charges represented the third largest source of revenue (6.9 percent), edging out sales from hotel lounges (6.5 percent). While banquets are the largest source of beverage revenue, additional
analysis reveals that alcoholic beverage sales are greater in a hotel�s
restaurants as opposed to their lounges. We believe this is primarily
driven by the volume of wine sales within the restaurants.
Revenue Percent of Food and Beverage Revenue by Type of Hotel 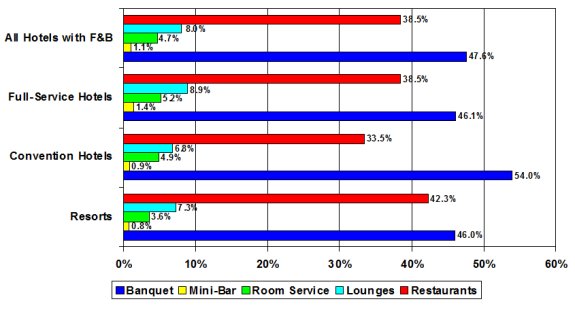
Source: PKF Hospitality Research .
While it is a minor cost, we found that over 50 percent of the full-service hotels in our Trends sample reported music and entertainment expenses within the food and beverage department. Music and Entertainment covers the costs for live or recorded entertainment. It does not include the cost of entertainment that is charged back to a guest. For those hotels that reported music and entertainment expenses in 2007, these costs averaged $137 per available room (PAR), or 0.5 percent of food and beverage department expenses. Resorts recorded the greatest expenditures ($331 PAR), followed by full-service properties ($113) and convention hotels ($58). Cancellation and Attrition One of the lessons learned by hotel managers during the 2001 � 2003 industry slowdown was the importance of cancellation and attrition clauses in meetings and banquet contracts. Given the large number of events that were cancelled during this period, the monies earned through cancellation and attrition penalties became a welcome source of revenue. As the industry enters its current period of sluggish performance, this issue has re-surfaced. According to the 10th edition of the USALI, revenue earned from the enforcement of both cancellation and attrition penalties should be recorded as rental and other income. This differs from the past practices of some hotels that recorded these sums as rooms revenue, thus inflating the calculation of average daily room rates. In 2007, cancellation and attrition revenue represented 0.8 percent
of total revenue, or 1.4 percent of rooms revenue, at those hotels that
reported this income. If cancellation and attrition revenue were
included in rooms revenue, the 2007 average daily room rate for these properties
would jump from the $201.25 ADR calculated in accordance with USALI standards
to $203.97.
Potential Impact on ADR 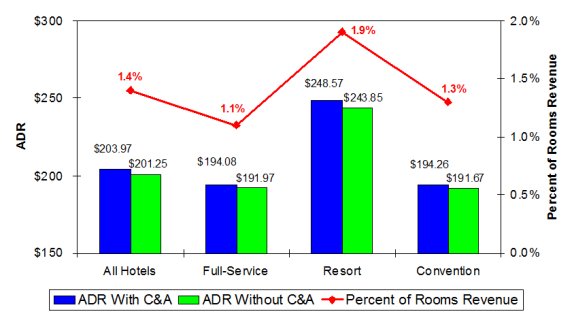
Source: PKF Hospitality Research Information Systems As technology expenditures continue to grow, the writers of the USALI thought it would be important to record all tech related expenditures in one category within a hotel�s operating statement. Therefore, an information systems expense line item was created within the administrative and general (A&G) department. This expense line captures the cost of management information system services, supplies, software, and equipment, excluding equipment rental and capital items. Due to the integrated nature of most systems, this line item includes the cost of maintaining telecommunications equipment, property management systems, and point-of-sale devices. The labor costs associated with dedicated information systems maintenance personnel are included in A&G salaries, wages, and benefits. In 2007, information system expenditures averaged $201 per available room, or 4.7 percent of all A&G department expenses. Convention hotels spent the most on a dollar-per-available room basis ($396), versus limited-service properties that spent the least ($93). E-Commerce For the past few years, PKF Hospitality Research (PKF-HR) has conducted special analyses of movements in property-level marketing department expenditures. One consistent trend was a steady decline in the amount property�s spent on advertising. What was not known is how many dollars were being diverted to internet related marketing tactics, and how these dollars were being recorded. To assist management with the tracking of internet related marketing costs, the 10th edition of the USALI created an expense category entitled e-commerce within the marketing department. This line item captures the cost of web site development, maintenance, and registration fees, link costs, and the cost of producing a virtual tour. For those properties that reported e-commerce expenses, these costs
averaged $213 per available room in 2007, or 3.3 percent of all marketing
department dollars. Resorts spent the most on a dollar-per-available
room basis ($263), versus convention properties that spent the least ($133).
A negligible amount of limited-service properties recorded e-commerce expenses.
Dollars Per Available Room 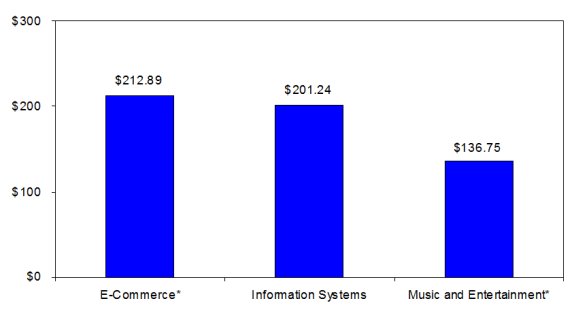
Source: PKF Hospitality Research Change The lodging industry will continue to evolve. Creative leaders
will invent new sources of revenue, while improvements in technology will
allow for improved tracking of expenses. All these new statistics
and measurements will eventually find their way on to the hotel operating
statement. In turn, PKF-HR will continue to adjust the data we capture
and present to industry participants through our benchmarking reports.
Robert Mandelbaum is the Director of Research Information Services for PKF Hospitality Research (www.pkfc.com). This article was published in the October 2008 issue of Lodging magazine. |
| Contact:
Robert Mandelbaum
|
|
|