 |
|
|
|
|
|
|
|
|
| by: Robert Mandelbaum and Jack Corgel, April 2007
To the novice, the lodging industry looks very glamorous - tall shiny buildings full of beds and adult beverages on the inside, with infinity pools and lush green golf courses on the outside. However, as most active participants in the industry are aware, the stresses of investing in a hotel are many:
What can hoteliers do to ease the stress? One strategy is to focus on a segment of the industry with a more predictable pattern of revenue and profitability. In theory, the greater predictability of performance from hotel operations, the less worrisome owners need to be when evaluating their investment. Arguably, a lower risk level can be assigned to an investment with a high degree of predictable performance. It is important to note that predictability does not necessarily lead to profitability. In fact, the least predictable revenue and profit streams often come from the most profitable operations. Investors need to evaluate the level of risk they want to take with the return they will receive. If the reward significantly outweighs the risk, then an opportunity might exist. To measure relative risk within the lodging industry, we analyzed the stability of total revenue and net operating income (NOI) data from 450 properties that participated each year from 1995 through 2005 in our Trends in the Hotel Industry survey. The survey sample was divided into six chain scale categories as defined by Smith Travel Research: economy, midscale without food and beverage, midscale with food and beverage, upscale, upper-upscale, and luxury. For the purposes of this analysis, NOI is defined as income before deductions for capital reserve, rent, interest, income taxes, depreciation, and amortization. The measurement used to analyze the predictability of performance is the Coefficient of Variation (CV). The CV is calculated by dividing the standard of deviation of property performance within each chain scale, by the mean performance of the same grouping. The lower the CV, the less variation there has been in the total revenue and profits generated among the properties within each category. Less variation means more predictability. Further insight comes from analyzing the CVs for each chain scale within three distinct time periods during the past 10-year business cycle. The three periods were:
Predictability of Total Revenue and NOI* All Hotels Coefficient of Variation** 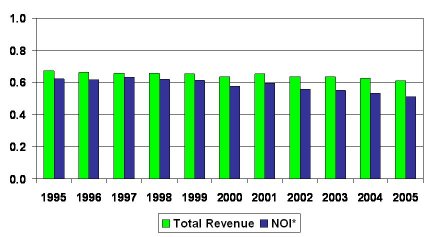
Notes: * Income before deductions for capital reserve, rent, interest, income taxes, depreciation, and amortization. ** Lower coefficient equals less variation, or more predictable. Source: PKF Hospitality Research Stability at the Extremes The coefficients of variation for total revenue and NOI in the lodging
industry have remained fairly constant from 1995 through 2005. There
has been a slight downward trend since 2001, but it is insignificant.
Coefficient of Variation* by Business Cycle 
Note: * Lower coefficient equals less variation, or more predictable. Source: PKF Hospitality Research Coefficient of Variation** by Business Cycle 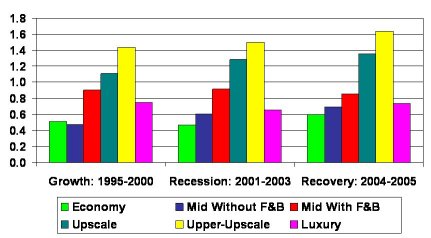
Notes: * Income before deductions for capital reserve, rent, interest, income taxes, depreciation, and amortization. ** Lower coefficient equals less variation, or more predictable. Source: PKF Hospitality Research When analyzing the CVs of the different chain scales, we do find some significant differences in relative performance stability. This analysis reveals that the most predictable revenue and profit streams are generated by properties at either end of the chain scale spectrum. Hotels in the economy, midscale, and luxury sectors have revenue and profit CVs less than 1.0. In other words, within each of their respective categories, economy, midscale, and luxury hotels perform within in fairly tight revenue and profit parameters. Since performance is less variable, is can also be classified as less risky and more predictable. What do these properties with disparate pricing profiles have in common? For the most part, economy, midscale, and luxury hotels share the following features not typically found in upscale and upper-upscale properties:
On the other end of the spectrum, hotels in the upscale and upper-upscale chain scale segments have revenue and profit CVs above 1.0. This indicates that there is a greater degree of variation in performance among these larger, more heterogeneous properties that offer more extensive facilities, services, and amenities. Given the relative instability of revenue and profit streams in these two segments, an investment in upscale or upper-upscale properties can be view less predictable, or more risky. Consistency over Time Our analysis also analyzed the variation of revenues and profits during the three different stages of the last 10-year business cycle. The purpose was to evaluate variances in performance during periods of industry expansion and contraction. In general, we observed minimal changes in the degree of variation in total revenue during the previous three periods of industry growth, recession, and recovery. In the economy, midscale without F&B, and upper-upscale categories, revenue variability increased slightly through each economic scenario. Meanwhile, the variation of revenue performance among hotels in the midscale with F&B, upscale, and luxury segments was a little less during the recent recovery period then it was during the growth years of the last 1990s. For these properties, top-line performance has become more consistent as the industry recovers from the 2001 � 2003 recession. The changes in profit CVs were greater than the changes noted for revenue variation. Variation in profit among hotels in the midscale with F&B, upscale, and upper-upscale segments has steadily increased during the past 10 years. Concurrently, we did observe lower degrees of profit variation during the recession for properties in the economy and luxury sectors. Once again, there appears to be a high degree of consistency in performance at the extremes of the chain scales. Due to the relatively limited complexity of their operations, economy and luxury hotel profit performance compacted uniformly during from 2001 to 2003. Tolerance Is Personal Size and complexity matter when thinking about the risks related to movements in hotel revenues and NOIs. In this article, we present measurements of revenue and profit stability within the lodging industry that will assist an investor in measuring risk. However, we have not provided a complete analysis of risk adjusted returns. The degree to which a hotel investor can tolerate different levels of performance variation, and its associated risk, is highly personal. Some people prefer to own in a more predictable environment with relatively steady flows of revenue and profits. Others will take the greater risk of undulating performance while enjoying the higher highs and tolerating the lower lows. Either way, if people invest within their comfort zone, they should have an enjoyable time in the lodging industry. Robert Mandelbaum is the Director of Research Information Services for PKF Hospitality Research. Jack Corgel is the Robert C. Baker Professor of Real Estate at the Cornell University Hotel School and a consultant to PKF Hospitality Research. For more information on PKF�s Trends in the Hotel Industry report, please visit our website at www.pkfc.com. This article was published in the March 2007 edition of Lodging Magazine. |
| Contact:
Robert Mandelbaum
|
| Also See: | Let Them Eat Cake: The Growing Contribution of Hotel Food and Beverage to the Bottom Line / Gregory J. Miller - PKF / April 2006 |
| View from the Bottom Different than from the Top / Robert Mandelbaum / July 2005 |
.