 |
 |
|
|
|
|
|
|
|
| By: Robert Mandelbaum, December 2005
Immediately after a catastrophic event such as Hurricane Katrina, the thoughts of hotel owners and operators go in many directions. First priority is the safety of the guests and employees. Once the human situation is secure, attention then turns to rebuilding the facilities and services of the hotel and getting �back to business.� Gather Your Historical Data What is frequently overlooked in the immediate turmoil is the need to secure important data and documents. This information is especially vital for those owners that wish to recover lost business income from their insurance company. While the actual filing of claims and negotiations may not occur until a year or two after the horrific event, several pieces of data and documents need to be gathered in the short-term in order to achieve a favorable settlement later on. After working with our clients to recoup business interruption benefits from their insurance companies, we have found certain data and documents to be extremely useful in our calculations of lost revenues and profits. The following is a partial list of reports (effective the day of the catastrophic event) that should be gathered and preserved by management.
Once the historical performance data is gathered from the documents listed above, the next step is to estimate how the hotel would have performed if the catastrophic event had not occurred. To prepare this forecast, we utilize budget, marketing plan, reservation, and group booking information contained in the secured documents. In addition, we rely on the most recent forecast developed prior to the catastrophic event for the subject property�s MSA. Using the MSA forecast as a baseline for future supply, demand, and revenue conditions within the market for the projection period, we then estimate the market penetration of the subject property based on historical correlations to MSA performance. This provides us with estimates of the potential rooms revenue the subject property would have earned had the catastrophic event not occurred. From these estimates of rooms revenue, we then prepare projections of net income using historical financial statements from the subject property, as well as data from our firm�s Trends in the Hotel Industry database. The calculation of lost business is derived from the difference between the performance of the subject property estimated under the �no catastrophic event� scenario, and the data from the actual performance of the hotel during the projection period. Estimates can be made for lost room nights, revenue, and net income. Objectivity Is Key A key to the lost business calculation is the ability to provide an objective estimate of the �no catastrophic event� scenario. The foundations of this estimate are the actual advanced booking data from the subject hotel and the MSA forecast. Since the MSA forecast was developed prior to the catastrophic event, it can be viewed as the prevailing outlook for future market conditions as of the day of the event. In conjunction with Torto Wheaton Research, PKF Hospitality Research prepares econometric forecasts of hotel supply, demand, occupancy, ADR, and RevPAR for 53 major markets across the nation. The forecast reports are entitled Hotel Outlook. Each Hotel Outlook report contains forecast performance data for both full-service and limited-service hotels in a given market. The forecasts are made for a six-year period, and are updated every three months. The Hotel Outlook econometric model is based on data from economy.com, Smith Travel Research, Torto Wheaton Research, and PKF Hospitality Research. An accuracy analysis conducted in early 2005 proved the Hotel Outlook forecasts to be 99.9 percent accurate. Hypothetical Lost Revenue For New Orleans To depict how lost business can be calculated, we have prepared a hypothetical lost rooms revenue calculation for the full-service hotels in the New Orleans MSA. It is very important to note that this example is intended solely to demonstrate our lost business methodology. The two recovery scenarios outlined below do not necessarily represent our firm�s opinion on the future performance of the New Orleans full-service hotel market. The Fall 2005 Hotel Outlook forecast for the New Orleans MSA full-service hotel market was developed on August 18, 2005, a full 11 days before Hurricane Katrina hit the coast of Louisiana. The Fall 2005 forecast projected a 65.8 percent increase in the rooms revenue collected by New Orleans full-service hotels from year-end 2004 to 2014. The bases for this forecast were a 27.6 percent increase in supply, a 25.4 percent increase in demand, and a 32.2 percent jump in room rates. In aggregate, the full-service hotels of New Orleans were forecast to generate an additional $526.3 million in rooms revenue from 2004 to 2014. With the �what would have been� scenario developed based on the Hotel Outlook forecast, we then put together two hypothetical recovery scenarios for the New Orleans full-service hotel market. One scenario is based on a slower and weaker recovery pattern. The other assumes a quicker and stronger recovery. The following bullet statements state the assumptions made for the two hypothetical recovery scenarios: Slow / Weak Recovery
By subtracting the rooms revenue of the recovery scenarios from the
rooms revenue of the Hotel Outlook forecast, we are able to calculate the
revenue deficits (Chart B). As would be expected, the revenue deficits
are greater under the slow / weak scenario, especially during the initial
years of the projection period.
New Orleans Full Service Hotel Market Rooms Revenue Collections Comparative Scenarios 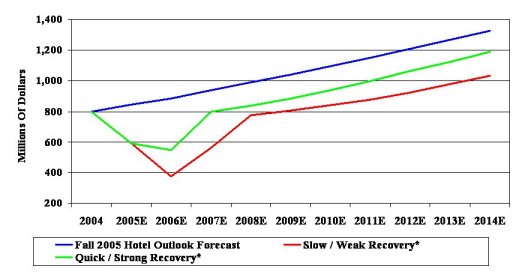
Note: * Hypothetical scenarios for demonstration purposes. Sources: STR / TWR / PKF-C New Orleans Full Service Hotel Market Rooms Revenue Deficits Comparative Scenarios 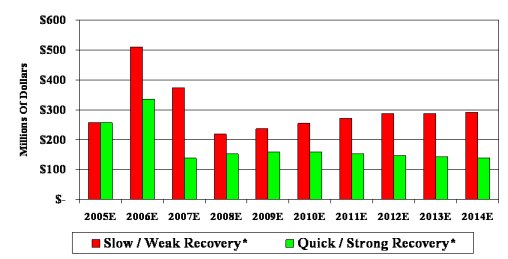
Note: * Hypothetical scenarios for demonstration purposes. Source: PKF-C Given the assumptions made for this demonstration, a quick / strong recovery scenario would result in a total rooms revenue deficit of approximately $1.8 billion over the 10 year projection period (Chart C). On the other hand, a slower and weaker recover would generate a rooms revenue deficit of $3.0 billion. . New Orleans Full Service Hotel Market Cumulative Rooms Revenue Deficits 2005E - 2014E 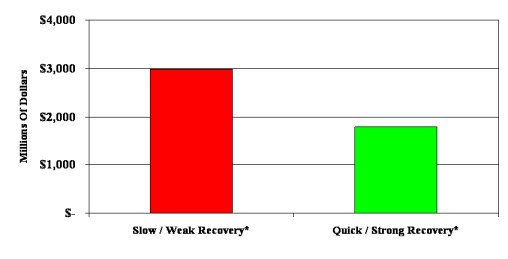
Note: * Hypothetical scenarios for demonstration purposes. Source: PKF-C The Bottom Line Really Counts It is important to note that the preceding example portrayed the methodology used to calculate lost revenue. For most business interruption insurance claims, it is the lost net income that would be estimated. As mentioned before, the translation of revenues to profits can be done based on the historical performance of the subject property, as well as industry wide financial benchmarks. Receiving your business interruption insurance benefits never fully alleviates the emotional damage and pain caused by a catastrophic event. However, the funds do go a long way to help preserve �the business.� Robert Mandelbaum is the Director of Research Information Services for PKF Hospitality Research. Assistance provided by Greg Crown and Kyle Bowman in the Dallas office of PKF Consulting. |
| Contact:
Robert Mandelbaum
|
| Also See: | Hotel Spas - The New Recreational Vehicle For Hotel Profits/ Andrea Foster and Robert Mandelbaum / October 2005 |
| The Accuracy of Hotel Budgets / Robert Mandelbaum and David Murff / September 2005 |