|
|
 |
|
|
|
|
|
|
PKF |
| August 2005 - Persistent low, long-term interest rates and the no-end-in-sight
recovery of the lodging sector create a dilemma for hotel Discounted Cash
Flow (DCF) number crunchers regarding the selection of a terminal cap rate
(the rate used to estimate resale value at the end of the holding period).
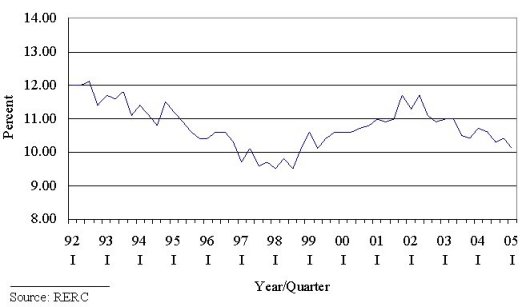
With capitalization rates sinking deeper into the single digits, sellers of respectable-looking hotels have begun to appear en masse under the theory that prices will not move much higher than today's levels. Liquid buyers come to terms with these seemingly opportunistic sellers because of the nearly impossible task of finding alternative placements for capital with such attractive current yields, forward-looking cash flow fundamentals, and inflation protection as hotel assets. An 'IRR burn' may be felt by today's buyers, however, if values decline by enough to compromise income returns when it comes time to check out of the hotel portfolio. So where do the DCF number crunchers come in? These stressed-out soles working diligently on the behalf of buyers and sellers must decide on a terminal cap rate to model current deals. A fee-seeking fund manager will waste no time informing the analyst that the standard industry practice involves adding 50 bps. to the current cap rate. Thus, the terminal cap rate number today might be 8% + .5% = 8.5%. A rebellious analyst with alternative job prospects in hand could respond by arguing that hotel markets are prone to cyclical movement and characterized by mean-reverting performance. Following this line of reasoning, the terminal cap rate for hotels should be elevated to approximately 10%. According to RERC survey data (see Exhibit 1) the average going-in hotel cap from 1992-I through 2005-I equals 10.8% - so 10% is still an aggressive estimate for the long-run rate. The dilemma facing DCF makers - use a terminal cap close to the current rate or close to the long-run average rate! The difference between an 8.5% rate and a 10% rate translates into $176,471 in value per $100k of NOI ($100k/.085 - $100k/.10). And for a disposition fee rate of three percent, the opportunity fee loss equals $5,294 per $100k of NOI (.03 x $176,471). Assume a property has a $100k NOI that grows at 4% per year and will be sold in year five. Capitalizing the year six NOI by 10% and 8.5%, respectively, produces quite different expected IRRs. The fund manager would much prefer to do market deals with a 10.92% IRR based on an 8.5% terminal cap rate rather than an 8.15% IRR based on a 10.5% terminal rate. What's a Number Cruncher to do? The fundamental question becomes one of misrepresentation of the true IRR based on a faulty assumption about the terminal cap rate. Just as a terminal cap rate assumption of 8.5% may be too low in an 8% current pricing environment, a terminal cap rate assumption of 12% may be too high in an 11.5% current pricing environment. Certainly, this problem is not symmetrical because of the incentives on the part of fund sponsors is to use as low a terminal rate as somehow justifiable. To solve this problem we need to convince ourselves of three general
assumptions. First, transaction costs usually prohibit earning short-term
profits from trading hotel assets so holding periods will be long term
- at least five years. Second and most importantly, hotel incomes and values
are mean reverting. This empirical fact is becoming more-and-more evident
as we move through time with reliable data (see, for example, Exhibit 1).
Third, few if any sponsors will guarantee that they can correctly time
the markets. We have no choice but to trust history and the equilibrium
principles that keep driving the performance in real asset markets back
to a steady state - it's 10 percent!
|
| Contact:
PKF Consulting Corporation
|