|
|
|
|
|
|
|
|
| HotelBenchmark Special Report - April 2003
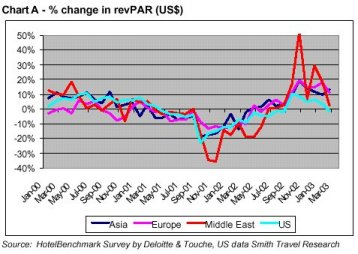
Whilst the performance of the Asian hotel industry mirrored that of the rest of the world during 2001, the region responded with some different tactics during 2002, which appear to have stimulated performance. At the end of 2002 it appeared as though the region may well have reached the bottom of the cycle and recovery was looming on the horizon. However, the conflict in Iraq and the recent SARS virus will undoubtedly have hindered the fragile recovery process. Following the financial crisis of 1997/8, the Asian hotel market had began recovering, albeit slowly. However, a number of events during 2001 - the overall global economic slowdown, particularly in the US and Japan, and then the unprecedented events of September 11 � conspired to dampen hotel performance across the world. The situation was exacerbated because the millennium year, with its high demand for entertainment and accommodation, was an unprecedented affair, and therefore the comparative 2001 hotel performance was always going to be challenging. But even suffering from a holiday hangover, no one could have seen how badly things would turn out. In this report we analyse how Asian hotels have performed post 9/11 compared to the rest of the world and illustrate how the industry may well have reached the bottom of the cycle, with a potential recovery looming, depending upon the fallout from the recent war in Iraq and the SARS epidemic. We analyse the relative performance of the various sub-regions � Northeastern Asia, Southeastern Asia and Australasia - and comment on reasons for the different performance of these regions. All data to compile this article has been extracted from the HotelBenchmark Survey by Deloitte & Touche. This database tracks the monthly performance of some 295,000 rooms across the Asia Pacific region and is widely regarded as providing the industry with the most comprehensive, authoritative and independent assessment of industry trends. During 2000, the World Tourism Organisation estimated that international tourism grew by 45 million arrivals, reaching unprecedented levels. Within East Asia and the Pacific, international visitor arrivals grew 10.5%, reversing a two-year declining trend. Pre 9/11, the World Tourism Organisation estimate that visitor arrivals to the region were continuing to grow strongly, up 9.9% and well ahead of the global growth rate of 2.8%. Post 9/11 however, visitor arrivals to the region fell 10.3%, and although this loss was substantial, it was not as marked as the declines experienced in other regions of the world - notably the Middle East and the US where the number of international visitor arrivals fell 30% and 24% respectively. To a certain extent the region benefited from being perceived as a relatively �safe� destination, as well as having a large intra-regional demand base (accounting for 70% of arrivals to the region), that was generally less effected than international demand. Preliminary 2002 data from the World Tourism Organisation suggests that international arrivals actually grew 3.1% to reach 715 million trips, (the first time ever that international arrivals have exceeded the 700 million mark). For the first time, Asia Pacific stole the number two spot from the Americas reporting 130 million international tourist arrivals for the year, a 7.9% increase over the previous year. Although the events of 9/11 are widely attributed for the industry�s weak performance during 2001, in reality, the pressure was felt a lot earlier in the year. Global revPARs when measured in US dollars, generally began to drop in April 2001, although for Asian hoteliers negative revPAR growth was reported in all but one month (February) during 2001 (see Chart A). During summer 2001, hotel revPARs remained under pressure. There was a slight recovery in August, which gave the industry hope
that the key conference months - and the most profitable - of September
and October would be better than initially forecast. Then, the events of
9/11 happened, leading to double-digit revPAR declines. Not surprisingly,
in September it was the US m arket that was most affected with revPAR falling
23% compared to September 2000. Asia Pacific reported its worst declines
in September too, with a revPAR fall of 19% compared to the previous year.
Hotels in Europe and the Middle East experienced a time lag, with the deepest
reversals reported in October and November. Within Europe, revPAR fell
by 14% in October before recovering marginally in November and falling
back again by 13% in December. With the prospect of retaliation against
al Qaeda in Afghanis tan, demand for hotels in the Middle East faltered,
with revPAR declines of 35% and 37% reported in October and November respectively.
 Within Asia there was a marked difference in the performance of the various sub-regions. We have analysed the performance of the three major sub-regions Northeastern Asia, Southeastern Asia and Australasia (as defined by the World Tourism Organisation) to illustrate this fact. As can be seen from Chart B, the Australasia market started to decline in April 2000 and remained in decline until April 2002. The exceptional month being September 2000 when Olympic fever boosted both occupancy and average room rates to usually high levels.
Hotels in Northeastern and Southeastern Asia managed to maintain positive revPAR growth until March 2001 when they fell into decline until April 2002. Hotels in Southeastern Asia and Australasia were most affected by the events of 9/11. In November 2001 hotels in this region reported a 27% revPAR decline. One of the reasons for this is that significant decline in demand occurred in Indonesia, where, following the civil unrest precipitated by the events of 9/11, the US government issued a travel advisory as security fears were heightened. As a consequence occupancy levels in the last four months of 2001 fell 24% in Bali and 13% in Jakarta. As both Charts A and B reveal, the industry has experienced positive
revPAR growth particularly in the last quarter of 2002, however this is
not surprising given the poor comparables for 2001. To assess whether the
industry is really recovering from the events of 9/11 we have furthered
analysed performance on a moving/rolling 12-basis. This technique
removes any seasonal bias from the equation and reveals that all parts
of the world are still trading at a revPAR deficit to Jan 2000 levels (see
Chart C).
 Although the decline in revPAR appears to have bottomed out in all regions of the world it is noticeable that Asia was the first region to recover, with revPAR beginning to make an improvement from April 2002 onwards. Europe turned the corner in May whilst the Middle East had to wait until July to see an improvement in revPAR. The recovery has taken even longer in the US where it took until August 2002 for the downward spiral to be halted. As a result of the swifter recovery, by February 2003 Asian hotels were achieving revPAR levels virtually comparable to January 2000 levels. This compares to a 4.1% revPAR deficit (US$2.11) for the US, a 4.1% revPAR deficit (US$3.30) for Europe and a 6.1% revPAR shortfall (US$2.79) in the Middle East over the same period. So what tactics have Asian hotels adopted to enable them to recover
their performance more swiftly than other areas of the world? Analysing
the components of revPAR � occupancy and average room rate � it is apparent
that on a rolling-12 basis Asia is the
To further understand the dynamics of the Asian market we have analysed
performance on a rolling-12 basis for the three major sub-regions as illustrated
in Chart D. In February 2003, both Northeastern and Southeastern Asian
were reporting revPAR levels above January 2000 levels at 5.7% and 4.3%
respectively, the Australasia market was still under pressure with revPAR
15.6% below January 2000 levels. The difference is in part explained by
the relative strength of the Australian dollar to the US dollar, as in
local currency the revPAR differential was just 3.3%. Both the Northeastern
and Southeastern regions have exhibited similar trends in terms of growth
(decline and then recovery) whilst the Australasia market entered a sharp
decline in March 2000 experiencing a US$11 fall in revPAR before recovery
commenced in February 2002. As of February 2003 Australasia revPAR is still
some US$10 below the high recorded in March 2000. As a consequence,
average room rates across the region are some US$15 below the highs recorded
in February 2000.
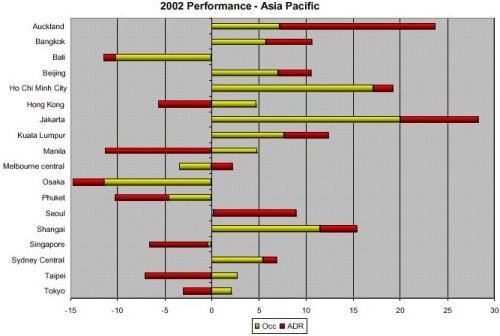
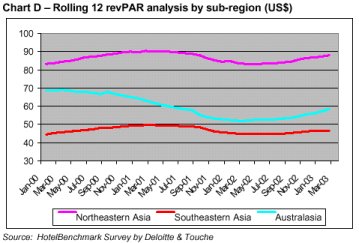 Chart D reveals a wide discrepancy between the revPAR levels being reported by the Asian sub-regions. Over the 38 months from January 2000 to February 2003 Northeastern Asian revPAR has averaged US$84 compared to US$45 revPAR for Southeastern Asia hotels and US$56 for Australasia hotels. The main reason for the differential in revPAR is due to the average room rates achieved by the different regions. Hotels in Northeastern Asia (which includes the cities of Tokyo, Hong Kong and Seoul) on average achieved room rates of around US$114 over the 38-month period compared to the US$71 average room rate reported by hotels in Southeastern Asia and US$78 for Australasia hotels. An analysis of the year-end 2002 data from the HotelBenchmark Survey for 22 cities across Asia reveals that the top six performing cities, with an average room rate over US$100, are all located in Northeastern Asia, whilst the five of the six worst performing cities are located in Southeastern Asia.
Generally speaking, hotels in Northeastern Asia achieve higher occupancy levels than their Southeastern Asia counterparts, with average occupancy levels between January 2000 and February 2003 being 74% for Northeastern Asia hotels compared to 63% for Southeastern Asia hotels. One of the reasons for this is that Northeastern Asian hotels are located in the hub of the financial activity of the region (the exception of the Lion City of Singapore) and so attract a robust mix of commercial and touristic demand from both international and intra-regional travellers. Additionally, many of the Southeastern Asia markets are still reeling from an over-supply situation caused by rapid development in the 1990�s. It should also be noted that many of these countries suffered from currency devaluation relative to the US dollar during the Asian financial crisis in the 1990�s, which is one reason why average room rates in relative terms are lower than the rest of Asia. Despite this, many of the Southeastern Asian cities have reported the best revPAR improvement year-to-date over 2001 levels according to the HotelBenchmark Survey � December 2002. Jakarta has been the region�s star performer during 2002 with a 27% improvement in revPAR driven by a 7% advance in average room rates and a 19% rise in occupancy. Admittedly, at 44%, hotels in Jakarta still have the lowest occupancy level of any market in Asia, but the city continues to try to absorb the new supply added during the late 1990s and improve its image abroad caused by political and civil unrest. Encouragingly, the city appears not to have been affected by the Bali bombings in October, which resulted in November demand on the island of Bali falling 62% to reach occupancy levels of just 15%. Consequently, Bali reported a 13% decline in revPAR (when measured in US dollars) for the year-end 2002, one of the poorest performances of any city surveyed. Boosted by the Americas Cup, hotels in Auckland sailed into second place as one of the regions best performing markets in 2002 with a revPAR increase of 28%, driven by a 8% rise in occupancy and a 19% increase in average room rates. Ho Chi Minh City, Shanghai, Kuala Lumpur, Bangkok and Beijing all reported double digit increases in revPAR when measured in US dollar terms. Seoul, Sydney and Xian were the only other cities to record positive revPAR growth. In total, ten cities reported positive revPAR growth in 2002 when measured in US dollar terms and ten cities showed an improvement in average room rate. Only six cities reported declines in occupancy for the year, with Osaka reporting a 10% fall in demand. Whilst part of the fall in demand is attributable to the fact that the city lost occupancy during the 2002 Football World Cup - occupancy levels fell 25% as displaced domestic demand opted to stay away - the performance of Osaka must be taken in context of the exceptional performance that the city witnessed during 2001 following the opening of Universal Studios, and the fact that the city appeared to be unaffected by the events of 9/11. Meanwhile both Seoul and Tokyo benefited from World Cup Fever, with revPAR increasing 37% and 26% respectively during the month of June. The future prospects for the Asian hotel industry are inextricably linked
to the profound change socially, politically, economically, demographically
and environmentally that is occurring in the region. A number of leadership
changes have already occurred and several more are likely. Safety and security
is now a driving force in travel and tourism, and countries that continue
to be troubled by political unrest are likely to lose out on the potential
economic benefits of tourism. With the region stimulating 60% of global
tourism demand and travellers to the region spending over US$170 billion
annually, the travel and tourism product is clearly an integral part of
many countries economies. By 2020 the World Tourism Organisation
predicts that China will be the world�s number one tourism destination
and fourth major source of tourists. Australia is one country banking on
the future of the Chinese inbound market and hoping that by 2012 the number
of Chinese visitors will skyrocket to 1.4 million, making this Australia�s
biggest tourism market.
 Against this backdrop one could have anticipated that hotel performance should continue to improve during 2003, particularly in China where 2002 visitor arrivals were 10% ahead of 2001 levels. That said, the fallout from the U.S.-led war in Iraq and health fears wrought by a killer outbreak of atypical pneumonia (SARS) are currently having a devastating impact on Asia�s travel industry. Tourists are staying away, some flights to the region have been cancelled, hotel bookings and airline reservations are plummeting and fewer people are attending international sporting events and trade exhibitions. The prospect of a U.S.-led war in Iraq had put consumers on edge prior to the onset of hostilities and in the short term we can expect continued fear of travel due to the possible threat of retaliatory terrorism. This coupled with the downward spiral in consumer confidence is likely to further delay recovery of the travel industry and to put a damper on spring travel. A swift resolution to the conflict in Iraq is clearly desirable, as the continual uncertainty is impacting booking levels because consumers are unwilling to commit to future bookings. Thus, many of the emerging patterns in leisure travel can be expected to continue and perhaps even intensify. As the industry continues to live with uncertainty it must swiftly adjust to changing consumer buying-patterns and in particular the shorter lead-time of bookings through new and developing distribution channels
|
| Also See: | Seoul and Tokyo Hoteliers Score During World Cup / Aug 2002 |
| Hotels Struggle with World's Toughest Challenge / Deloitte and Touche / March 2003 |

 Julia
Felton is director of Deloitte & Touche�s travel, tourism and leisure
team based in London. In particular she was responsible for the launch
of the HotelBenchmark Survey, which is now firmly established as providing
the industry with the most comprehensive and authoritative source of independently
collated monthly performance data. The survey monitors the performance
of over 6,000 hotels across the world in terms of occupancy and average
room rate and 14-monthly bulletins are generated. Within Asia the survey
tracks the performance of some 1,150 hotels. Anyone wishing to learn more
about the survey should e-mail us at
Julia
Felton is director of Deloitte & Touche�s travel, tourism and leisure
team based in London. In particular she was responsible for the launch
of the HotelBenchmark Survey, which is now firmly established as providing
the industry with the most comprehensive and authoritative source of independently
collated monthly performance data. The survey monitors the performance
of over 6,000 hotels across the world in terms of occupancy and average
room rate and 14-monthly bulletins are generated. Within Asia the survey
tracks the performance of some 1,150 hotels. Anyone wishing to learn more
about the survey should e-mail us at