by Elaine Sahlins
HVS has tracked hotel construction costs throughout the United States since 1976. Each year, HVS researches development costs from our database of actual hotel construction budgets, industry reports, and uniform franchise offering circulars. These sources provide the basis for our range of component costs per room.
This 2014/15 survey reports updated per-room hotel development costs through the end of 2014, and considers data for six lodging types:
- Economy/Budget Hotels,
- Midscale Hotels without Food and Beverage (w/o F&B),
- Extended-Stay Hotels,
- Midscale Hotels with Food and Beverage (w F&B),
- Full-Service Hotels, and
- Luxury Hotels and Independent Resorts.
In the HVS Hotel Development Cost Survey, the elements of a hotel development budget are broken down into five general categories: Land; Construction Costs and Site Improvements; Soft Costs; Furniture, Fixtures, and Equipment (FF&E); and Pre opening and Working Capital. These categories provide general ranges for analyzing hotel development budgets on a per room basis. The classifications are broad enough for professionals with different expertise to work with and understand.
New-project construction cost data collected may increase the range and/or affect the mean and median of the construction cost components. The upper and lower ends of the ranges also consider changes in construction cost components derived from published sources and industry indexes, and information from architects, contractors, developers, lenders, and other professionals involved with hotel development projects.
The Hotel Development Cost Survey includes actual ranges of development costs in each category. The survey is not meant to be a comparative tool to calculate changes from year to year-rather, it represents the true costs of building hotels across the United States at the particular time. As in previous years, the data represent a wide array of geographical locations, from tertiary markets in the Southwest to mid- Manhattan. The development costs of the same hotel product, say a limited-service Fairfield Inn or Holiday Inn Express, can be more than triple the amount from one locale to the other.
WHY WE ARE NOT AFRAID OF NEW SUPPLY As we all know, the hotel industry is cyclical. When occupancy and average rate performance improves and financing is available, new hotels get built. We are in the midst of a robust operating environment and development period and new hotel rooms are expected to open at a vigorous pace for the next two to four years. Putting this data into context, however, shows that the new hotels opening now and in the near term are compensating for the dearth of new inventory during the last ten years. New construction is critical to maintaining the quality of hotel stock nationwide. As older properties age and are demolished or repurposed, new hotel inventory with current design standards is required to accommodate the increasing demand of the last few years. The supply that has opened since the nadir of the recession in 2009 has not kept pace with the nightly demand for hotel rooms.
FIGURE 1 – FIVE-YEAR COMPARISON OF HOTEL INVENTORY

While supply has grown 3.2% in the last five years, demand has grown approximately 5.3%. With this five-year lag in hotel construction relative to demand, occupancy for 2014 is anticipated to peak above the levels of the last two cycles. Because new hotel development is hard to justify until average rates and occupancies are peaking, the new supply is often out of sync with the demand cycle, and demand recedes as the new supply comes on line, frustrating owners and operators, and resulting in lower-than-projected average rates and occupancies. Given the lack of new supply in the last ten years and the strong demand levels of the last five years, the impact of new supply on a national level (barring any unforeseen event) may not have the strong impact that prior supply cycle increases witnessed.
A hypothetical analysis of the impact of supply is presented in the following chart.
FIGURE 2 – HYPOTHETICAL ANALYSIS OF SUPPLY AND DEMAND
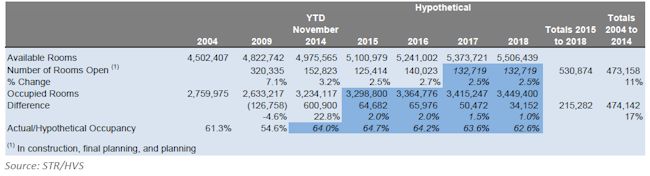
In the past ten years, the number of hotel rooms in the US increased approximately 11%. During this same period, the number of occupied rooms grew by approximately 17%, reflected in the almost 10- occupancy-point increase since the worst year of the recession.
According to the STR pipeline (November 2014), the current number of hotel rooms in construction, final planning, and planning is 413,419. About 64% of these rooms are expected to open in 2015 (2.5% supply growth) and 2016 (2.7%). Calculated in the blue-shaded portion of the chart, supply growth is projected to continue at 2.5% annually for the next two years as demand growth moderates from 2.0% to 1.0% during this same period. The resulting national occupancy levels would still exceed the occupancy of
61.3% recorded ten years ago and at the pre-recession peak in 2007. In this hypothetical scenario, the national hotel industry is expected to maintain its current healthy condition and be unaffected by any particular event or trend.
This is not to say that certain markets or regions won't be more or less affected by new supply. Some markets, including Houston, Miami, Denver, Nashville, New York, and Seattle, are expected to record double-digit increases in new hotel rooms. Other markets are anticipating much less new supply. Areas with high barriers to entry such as San Francisco and Hawaii, which could readily absorb new rooms, are missing out in the cycle. Other markets with hotel performance that is still recovering are anticipated to witness very little new hotel development.
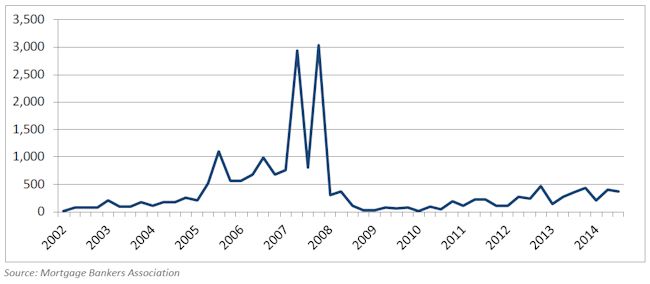
Influencing the potential of new hotel development is the availability and cost of hotel construction financing. While developers are currently benefiting from low interest rates and a more enthusiastic lending environment, hotel debt is still constrained relative to the peak of the last cycle. Data from the Mortgage Bankers Association's Quarterly Origination Volume Index illustrates the historical trends of the volume of hotel financing.
FIGURE 3 – HOTEL LOAN ORIGINATION VOLUME INDEX
Comparing this data to the volume of hotel construction put in place as tracked by the US Census Bureau shows the expected lag between loan origination and construction and the consistency of the two data sources.
FIGURE 4 – HOTEL LOAN ORIGINATIONS AND HOTEL CONSTRUCTION VOLUME
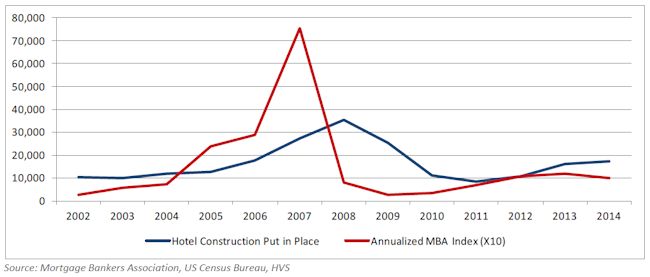
As seen in Figure 3, on a quarterly basis, loan originations appear to be relatively stable for the last four quarters, but as shown in Figure 4, on an annual basis the trend seems to be moderating. It is possible that the pipeline of proposed new hotel supply will also be tempered in the next few years, particularly if interest rates increase.
CONSTRUCTION COST TRENDS Strong residential construction activity in 2013 put upward pressure on construction costs for all asset classes in 2013, but 2014 has been characterized as an "anemic" year for residential developments. In contrast, commercial construction in 2014 was up over 2013 levels (by as much as 11%, depending on the source). The relatively low level of housing construction has helped to moderate national cost levels. Debt and equity are more available now than any time since 2006 and 2007, further spurring new construction in many markets across the country.
The competition for sites continues to intensify. In dense urban and suburban areas, multifamily housing and condominium projects can provide a more lucrative return than hotel development, particularly for well-located sites. Many of the projects currently in the pipeline are being developed on land that was planned for hotel use in the last cycle and was already secured for hotel development; absent these pre- existing plans, some of these sites might well be selected for residential projects.
Further affecting the feasibility of new hotel construction are the increases in development costs. In some markets such as New York, San Francisco, and Miami, hotel construction costs have steadily escalated in the past three years. In Miami, for example, full-service and luxury hotel developers report cost increases of 25% to 30% over the past two years. Other markets have shown more moderate construction cost increases.
In contrast to the cost trending for hotels, nationwide construction costs are reported to be around 2.8% to 3.0% higher in 2014 than 2013. Costs of the largest material components have varied. Lumber costs are reported to be up 5.6% for the year, while steel increases are 1.4% to 2.3% for the various building products. Cement prices are 5.0% higher than in 2013.
According to reports, the construction labor workforce has declined 27% from its peak of 7.5 million workers in 2007. The shortage of skilled laborers is expected to continue to affect construction cost over the foreseeable future, as the average age of construction workers is 54 years.
Offsetting some of these adverse trends, cost controls are continually improving with the integrated design and construction technology. Costing is considered the fifth dimension in modeling-increasingly sophisticated software allows the attaching of costs to the designs and in real time; showing the impact of changes on the construction budget. Evolving project software will incorporate life cycle modeling that will project what the long-term costs of building maintenance and replacement costs will be over time based on the materials and construction.
Design Considerations In the current development cycle, design and construction trends are anticipated to continue to influence development costs. Current trends in hotel development include the following:
Limited- and select-service hotels remain the most feasible to develop due to their less- extensive facilities and profitable operating models.
Designing for millennials is a hot topic. Millennials are seeking out hotels which promote sustainability and healthy lifestyle choices with a local personality. Key amenity requirements for millenials are communal spaces and great technology.
Public spaces are increasing in importance (again). Spurred by the preferences of millennials, working and socializing, or just hanging out in the lobby and/or public space, are a priority for some guests while staying in the hotel. Lobbies are being designed with all-day food and beverage options. Seating areas are becoming work areas for individuals or small groups. Robust high-speed access and plenty of electrical outlets are critical.
Technology in all areas of hotels is adding to construction costs. Additional wiring is needed to meet guests' requirements for more outlets in public areas and guestrooms. Back-of-the-house efficiencies are also expected to be supported by more technology. Experienced developers advise holding off on tech decisions for a project until the last possible moment to take advantage of the most current technology and trends.
The increasing number of new brands is helping to drive the surge in development. The availability of new brands and products in strong and growing markets provides developers with more options.
Areas with high barriers to entry are attractive markets for developing hotels with micro guestrooms. Just as residential developers are building multifamily projects with smaller apartment units, hotel products with guestrooms of 180 to 250 square feet are being considered in many urban areas. The small guestrooms make the attractiveness and utility of the lobby space even more essential.
Energy efficiency is more important than ever. Solar panels, vehicle-charging stations, facade solutions, lighting systems, and other tools for sustainability are becoming mandatory considerations for hotel developers. Operators report that hotel guests and meeting planners consider the environmental strategy of hotels to be part of the booking decision.
HOTEL DEVELOPMENT COST CATEGORIES The Uniform System of Accounts for Hotels provides industry participants with a common language for analyzing the financial performance of a hotel. While the American Institute of Certified Professional Accountants' methods are prescribed for construction accounting, a consistent format for develoment budget is woefully lacking. As consultants preparing market and feasibility studies or as appraisers developing opinions of value for construction financing, we have reviewed hundreds of hotel development budgets and no two are alike. Evaluating the completeness of a budget is often challenging, as different line items are used and some components are unintentionally omitted. We can be presented with budgets showing extraordinary line-item detail, with every material component itemized. Others are too cursory and lump together major items without sufficient detail. We are often asked for input on hotel development budgets and find that lacking a common language for identifying relevant cost items is a challenge for many industry participants. Based on our experience preparing the annual Hotel Development Cost Survey we have developed the following summary format for hotel development budgets, which forms the basis for our cost categories. We find these categories are meaningful for hotel professionals when undertaking an analysis relating to hotel feasibility. While our structure is not an accounting practice, it does provide a basis from which to analyze proposed projects.
The following chart shows our five categories and the typical items that each include.
EXHIBIT 1: HVS HOTEL DEVELOPMENT COST CATEGORIES
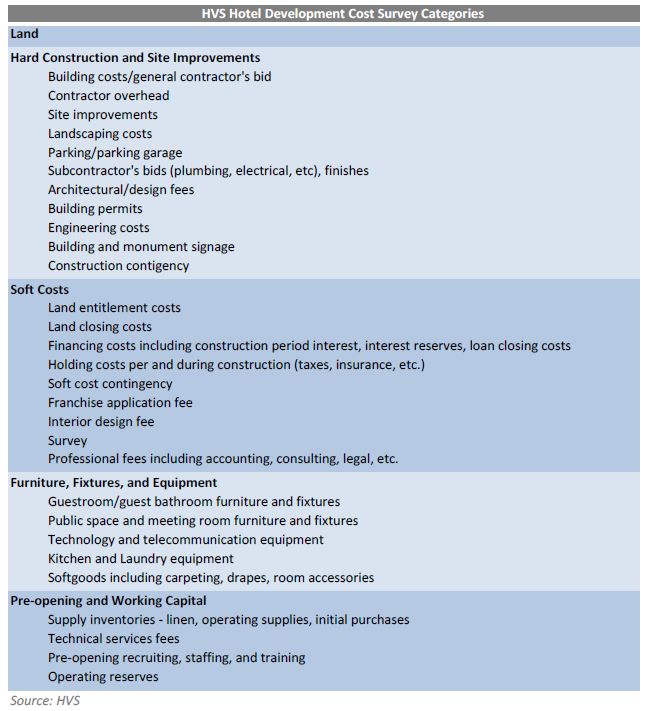
The categories are not meant to be all encompassing but do reflect the typical items in a development budget. Land is often the most important component as this cost can make or break the profitability of a project. Oftentimes, the dollar amount of the land in a development budget is based on a contribution by an equity participant or an allocation based on the overall cost. When evaluating the feasibility of a project, the land cost is most relevant when it is an actual purchase price or based on the market value of the site "as is." In some budgets, we may see a development fee or developer overhead. If the amount represents the overhead and salaries and wages earned by the development team during a project, this is included in the soft costs. If the fee represents the profit on the project, it will be excluded.
Financing and operating reserves are important items to include in development budgets. These costs are often missing in budgets that we review. Sometimes these costs or other pre-opening and marketing costs are omitted from the budget and amortized in the profit-and-loss statements. It is critical to acknowledge their overall costs as part of the potential feasibility of a new hotel.
In construction accounting, development budgets are generally presented in far greater detail than for general investment analysis. For the purposes of considering the overall feasibility of a proposed hotel, we find our Hotel Development Cost Survey categories cover the major components of hotel construction costs.
PER-ROOM HOTEL DEVELOPMENT COSTS The nadir of hotel development costs in the most recent cycle was 2010; costs in most categories have increased since then. The averages and medians reflect a broad range of development projects across the US, including projects in areas with low barriers to entry and in high-priced urban and resort destinations.
EXHIBIT 2: 2014/15 HOTEL DEVELOPMENT COST PER ROOM AMOUNTS
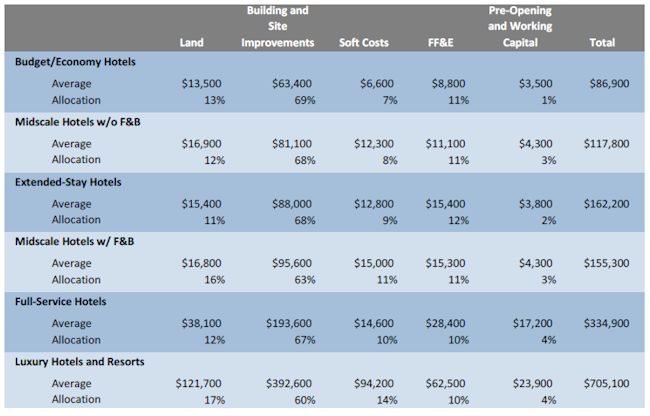
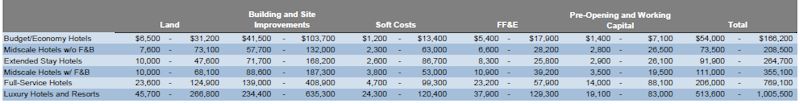
EXHIBIT 3: HOTEL DEVELOPMENT COST SURVEY PER-ROOM RANGE OF COSTS FOR 2014/15
It is important in this analysis to reiterate the lack of a uniform system of hotel development budget allocation. Hotel development costs are accounted for in numerous and varied line items and categories. Individual accounting for specific projects can be affected by tax implications, underwriting requirements, and investment structures. For example, in a development project, furniture, fixtures, equipment installation, and construction finish work can overlap. Accounting for these items is not always the same from one project to another.
Land components of budgets can be based on purchases, appraised value, or as equity contributions by parties to the deal. For many projects the land component may have been acquired several years prior to the development. Some land transactions did not include entitlements. The range of land amounts in budgets does not necessarily equate to a site recently purchased for a hotel project that is ready to be developed and fully entitled.
Finally, we recommend that users of the HVS Hotel Development Cost Survey consider the per-room amount in the individual cost categories only as a general guide for that category. The totals for low and high ranges in each cost category do not add up to the high and low ranges of the sum of the categories. None of the data used in the survey included a project that was either all at the low range of costs or all at the high range of costs. A property that has a high land cost may have lower construction costs and higher soft costs. Hotels developed in high-cost markets such as New York account for a small percentage of the projects but typically have per-room component costs that set the upper end of the range. The total costs shown in the preceding table are from per-room budgets for hotel developments and are not a sum of the individual components.
All individual property information used by HVS for the development cost survey is provided on a confidential basis and is believed to be reliable. Data from individual sources are not disclosed.