Introduction
Lodging was the property sector most affected by the recession, but has shown a remarkable comeback during the recovery. After closing 2015 with strong hotel metrics and peak occupancy numbers, the US hospitality industry has reached a point in the current cycle where growth in average daily room rates (ADR) and revenue per available room (RevPAR) is slowing down. New supply is beginning to outpace demand and sluggish GDP and inflationary growth, recorded so far this year, have caused many industry experts to reduce their projections for the rest of 2016.
According to US Lodging research released by hotel research and data analytics firm STR, 2016 marked the industry’s first year-over-year quarterly occupancy decline in over six years as well as the lowest RevPAR growth since the start of the recovery in 2010. Hotel occupancy in the US fell 0.5% to 67% in the first quarter of 2016 while RevPAR growth for the first five months of the year dipped down to 3%. Compared to the 6-8% RevPAR increases the sector has been seeing in the past five years, CBRE projects RevPAR to only rise 4.2% for 2016. Despite expectations of deceleration in the next few years, hotel fundamentals are still considered strong and performance has remained near peak levels.
Another source of concern for the industry is the rising influence of the sharing economy. Highly successful sharing-based startups such as Airbnb and Uber have chipped away at the market share of traditional business vendors. In the 12-month period ending August 2015, the New York City lodging market was estimated to have lost over $450 million in direct revenue and roughly $1 billion in potential construction investment from Airbnb competition, based on a study commissioned by the Hotel Association of New York. The overall economic and lodging market impact was calculated at $2.1 billion, with Airbnb’s market share and impact expected to expand in the next few years. Although traditional hotel chains have experienced some loss of potential business because of Airbnb, their overall performance has shown that the two lodging groups have been able to prosper while serving different consumer segments.
Figure 1. Lodging – CMBS Delinquency Rate 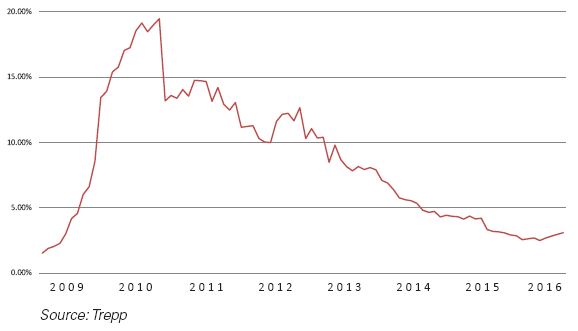
A History of Volatility
Since hotel performance is particularly sensitive to market downturns, the economic recession hit the hospitality sector hard as households and corporations cut back on spending for leisure and business travel. The decline in tourism activity lead to lower hotel occupancy and discounted average daily rates during the recession, prompting an increasingly larger share of lodging loans to fall into delinquency. Trepp’s delinquency rate for loans backed by lodging properties reached an all-time high of 19.46% in September 2010, which was a 12.87% increase from the same period a year before. As the economy recovered and tourism picked up again, lodging performance improved and the delinquency rate dipped back down to single-digits in early 2013. The delinquency rate for lodging loans, which has been fluctuating between 2-3% in the past year, sits at 3.08% for the month of June while the overall average for the past 12 months is 2.82%.
Figure 2. Lodging CMBS Issuance by Deal Type 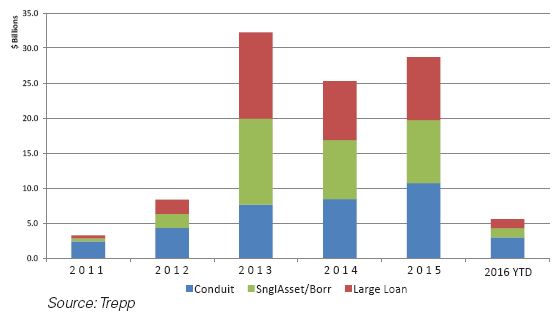
Volume Lowest in Years
In early 2016, the CMBS market was characterized by a period of extreme volatility due to uncertainty stemming from the macroeconomic environment and upcoming risk retention regulations. Uneasiness from the global economic landscape and new Dodd-Frank provisions, coupled with falling oil prices and Fed rate hike potential caused fixed-income spreads to go through a widening spree in late February and early March. Lenders found it difficult to price loans profitably and total issuance slowed to its lowest level in years, falling over 47% in the first half of 2016 from the same period in 2015.
In 2014 and 2015, lodging CMBS issuance topped $42.3 billion. According to Ernst and Young, CMBS served as the largest source of lending for the lodging sector last year, accounting for 39% of all hotel originations in 2015. Private lodging issuance for the first half of 2016 dropped to $4.5 billion, down from the same-period issuance of $7.1 billion in 2014 and $13.3 billion in 2015.
Cap Rates Indicate Strong Property Values
New CMBS lodging issuance shows a trend of loosening underwriting practices in a competitive lending environment as well as the effect of the market volatility seen earlier this year. Cap rates, which measure the income generated on a property given its appraised value, have generally fallen in the past few quarters. This may be attributed to the general strength of lodging property values and a greater willingness of lenders to underwrite lower investment returns. The weighted average cap rate of lodging loans dropped from 8.72% in the first quarter of 2015 to 7.92% in the last quarter of the year. As a result of the spread rout in 2016, cap rates spiked back up to 8.69% in the first quarter amid low issuance.
Figure 3. Conduit Lodging LTV & Cap Rates 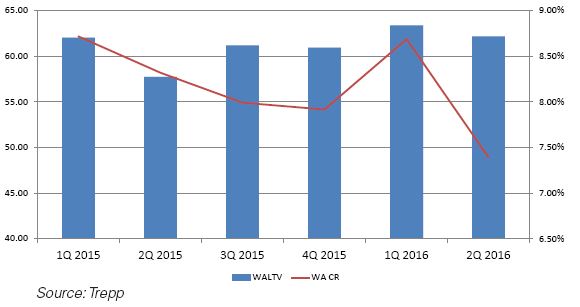
Amortization Shows Less Appetite for Risk
Compared to fully amortizing loans that require monthly principal payments, mortgages with some sort of interest-only structure built in are deemed riskier since borrowers can postpone principal payments until maturity and have less equity at stake if the property runs into financial trouble. The proportion of newly issued lodging loans with interest-only structures has ticked down within the past 12 months compared to those securitized in late 2014 and early 2015. Loans with full term IO and partial term IO made up over 80% of loans issued in the second half of 2014 and the first half of 2015. That proportion dwindled considerably to 54.32% for lodging loans issued within the past four quarters, indicating that lenders have become more cautious.
Figure 4. : New Lodging Issuance by Amortization Type 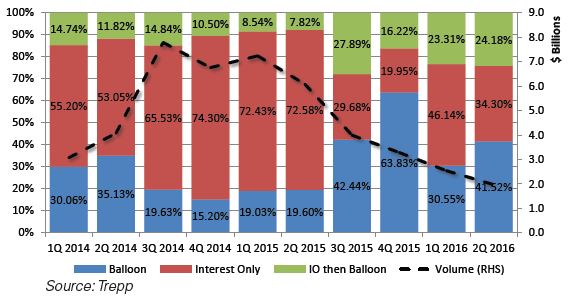
Loss Severity Inches Up
In the first half of 2016, close to $6.6 billion in CMBS lodging loans were liquidated with losses. The 6-month moving average loss severity for hotel loans disposed with losses has been inching up in the past few months, rising above 60% between December 2015 and May 2016. While loans paid off with losses have been taking a bigger hit, the cumulative loss of all loans for the first half of 2016 has decreased substantially in 2016 to below 2%, down from 4.38% for the same period in 2015 and 19.46% in 2014. Lodging conduit loans that took the heaviest losses within the past year include the $72.8 million DLJ West Coast Hotel Portfolio (82.23% loss severity), the $117 million Loews Lake Las Vegas note (100%), and the $134.3 million Westin Casuarina Hotel & Spa (49.64%), all of which were backed by hotels on the West Coast.
Figure 5. Losses on Disposed Lodging Loans 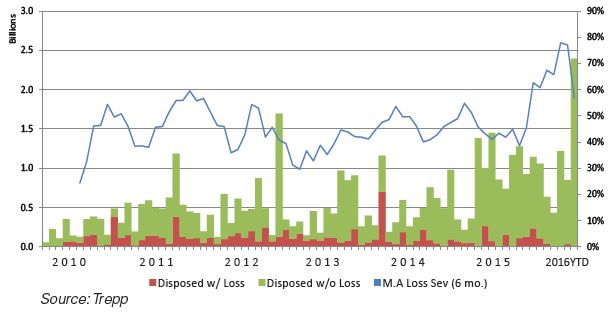
Maturing Lodging Loans Outlook
CMBS investors have long been keeping a close eye on the “Wall of Maturities” as the large wave of CMBS loans originated between 2005 and 2007 are due to mature. Considering recent market uncertainty and volatility, many of these loans may face difficulties refinancing or paying off at maturity. With the second half of the 2015-2017 “Wall of Maturities” period still remaining, $193.2 billion in CMBS loans are scheduled to mature in the remaining two quarters of 2016 and 2017. Loans backed by lodging properties comprise 16.05% of this remaining balance. An additional $58.8 billion in CMBS loans will be up for refinancing between 2018 and 2020, 21.6% of which is made up of lodging loans.
Appraisal reduction amounts (ARA) listed for loans serve as an estimate of potential losses those loans may be subject to at disposition. For lodging loans maturing through 2017, 6.34% are currently categorized as delinquent while 4.77% are carrying ARAs. The majority of ARAs accumulated by maturing loans has been assigned to loans in the distressed pipeline.
Because hotel occupancy levels fluctuate constantly depending on room demand and time of year, lodging loans usually report lower average occupancies than other major property types. The average occupancy for outstanding lodging loans hovers within the 69-74% range for those maturing through 2020 and reaches 72.08% for mortgages due to pay off in 2016. Of the loans with scheduled maturities in this time frame, 52.57% have average occupancies above 75% and 84.27% are 50%-80% occupied.
Figure 6. Share of Maturing Lodging Loans 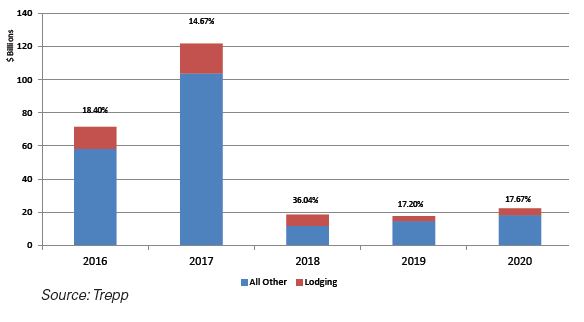
Major loans in the maturing pipeline worth monitoring in the coming months are those sponsored by leading hotel management firm John Q. Hammons Hotels & Resorts. Because of an ongoing legal dispute, the company recently filed for bankruptcy protection in June 2016 with plans for restructuring changes. Approximately $689.9 million in CMBS debt may be impacted by the bankruptcy filing, with the exposure spread across 10 deals. Loans totaling 48% of this balance have been transferred to special servicing in the past four months either due to maturity default or borrower bankruptcy. Reorganization within the firm could cause more of these loans to fall into trouble in the next few years.
Figure 7. Maturing Lodging Occupancy Rates 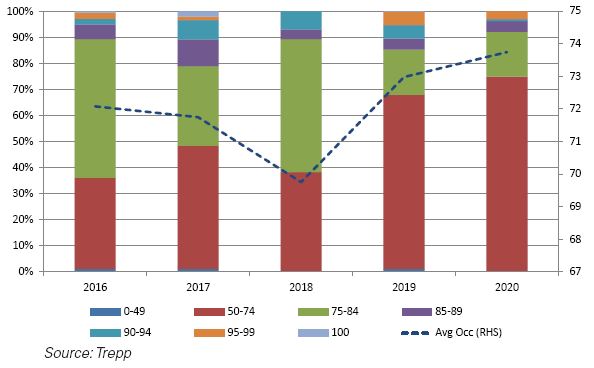
Lodging Outlook
Major headwinds such as the recent slowdown in the global economy, a growing supply pipeline that’s exceeding demand, and the rise of alternative lodging accommodations pose challenges for further growth in the hospitality industry. While the sector is expected to experience some cyclical deceleration in the coming months, the overall hotel industry is on an upswing and has been operating at peak performance levels. With maturing CMBS lodging loans boasting occupancy rates above the national average and delinquency percentages near pre-crisis lows, the US lodging outlook appears strong, particularly as worldwide economies improve and international travel continues to expand.
For inquiries about the data analysis conducted in this research, contact [email protected] or call 212-754-1010. For more information about Trepp’s commercial real estate data, contact [email protected].