By David Lund
Flow Thru, this is my abbreviation, is a catch all phrase that measures how much made it through your business comparing one period to another. What made it through, from revenues to profit. Another term to describe this measurement is retention. A good analogy to grasp the concept of flow thru is to compare it to your paycheck. Imaging I give you a $1000 a week raise. The question then is how much will end up on your pay vs. how much got eaten up by higher taxes and other deductions. The same goes for additional revenues in your business. If revenues are $50,000 higher this month than the same month last year, how much of the $50,000 will make it through to the profit line. How much will flow?
“it’s great that you increased the rate and overall revenues in my hotel, but what I really want to know is how much you will keep and give me in profits” – anonymous hotel owner
Managing flow thru in your hotel is a key attribute to understanding the profit model for your hotel. The reason it is so important to understand is the different characteristics that emerge when revenues go up or down in different departments. Measuring flow thru by department and by key driver is the basis for understanding your hotels real financial results and most importantly its financial potential.
Here are some motherhood questions to get your flow thru imagination going.
- The overall revenues year to date are up by 1.3 million dollars how much should flow in GOP? ?
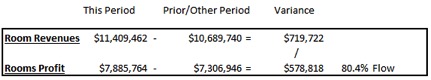
- Occupancy is up over last year by 5% – and the rate is up $15 as a result room revenues are up $720,000 – how much should flow in rooms profit and GOP?
- Restaurant average check is up by $2 and as a result food revenues are up $10,000 – how much should flow in F&B profit and GOP?
- Liquor revenues are up over last year in my lounge by $7,000 – how much should flow in F&B profit and GOP?
- Banquet food sales are $50,000 higher this month than the same month last year driven by higher volume and average check – how much should flow to the F&B profit and GOP?
The way we calculate flow thru is straight forward. The first step is you subtract the revenues from two different periods and step two is to subtract the profit from the same two periods and the thirds step is to divide the difference in revenues by the difference in the profit. See the sample charts below.

All the revenue streams in your hotel have two attributes, pricing and volume. Understanding the difference and measuring the impact is the key to understanding and measuring departmental flow thru.
Measuring flow thru to the prior period is normally a stronger comparison than measuring flow thru to budget or forecast. The reason being when we compare the flow thru from one real period to another real period it’s more of an apples to apples comparison. When we compare flow thru to budget were comparing a real result to a projection. A word of caution, when comparing the flow from one period to another it’s important to include any events that may have had an impact on the results. This is where a good memory and a great monthly property commentary come into play. Let’s say that last year in the month of May we had a great group month, off the charts because of a city wide. That fact will skew the flow thru to this month. Being able to articulate the impact of past and current events is very important.
Negative flow is also an important concept and calculation to master. When revenues decrease, we want to be able to mitigate the impact to the profit lines. We want to be able to retain the profit loss. If we don’t act we run the risk of losing 100% or even more of the lost revenue in the form of decreased profits.
Rooms Flow
The rooms department is the engine in 99% of the hotels in the world. The greatest contributor to performance is rate and then occupancy. If my rate goes up $10 over the same month last year and I sell 18,500 rooms this month, the same amount as last year, my room revenue just went up by $185,000. The question is how much should I be able to keep as profit. What we need to examine is what else would need to increase to compensate for the additional room revenue? This is the magic in the hotel business as very little needs to go up when my rate grows. Whether it’s a transient increase or group the impact is largely the same, i.e. Very Good! Depending on my segmentation I may need to spend some of this increased revenue on third party commissions. I also may need to spend more on my reservation expense from my brand, depending on the mechanics of the charge back. Other than these two cursory items no addition expense or payroll in the rooms department need be spent. Other costs that will be impacted by the increased revenues are credit card commissions, centralized fees and management fees. A good rule of thumb is I should see 90% of any additional revenues flow in rooms profit and 85% in GOP, that result from increased room rate. Your hotel manager may take it upon himself/herself to spend a little more this month to catch up on some cleaning or other expense but it is not directly related to the increase in rate. On the other side of the equation is occupancy. Let’s say my hotel this month saw an increase of 6 points in occupancy over the same month last year. This resulted in and an additional 300 rooms sold and an additional $45,000 in room revenue. The question is how much should flow? With occupancy, it’s a bit more complicated. Every time I sell a room I have both fixed and variable expenses associated with the sale. Taking the 300 extra rooms, that’s an average of 10 more per day. I don’t need huge amounts of additional resources at the front desk, in reservations or in guest services. I will however need additional room attendants and housekeeping labor. I will consume more amenities, guest supplies and probably should pay higher commissions to 3rd parties and more in reservation expenses to my brand. I will also pay higher credit card commissions, centralized fees and management fees. So, as a rule of thumb I should see 85% of any additional room revenues from increased occupancy as increased rooms profit and 80% in increased GOP.
F&B Flow
What is the increase or decrease in F&B revenue and where did it come from? In the food and beverage department we need to have a much bigger calculator to see what happened and what the results should be. We want to be able to measure the increase or decrease in all the dimensions that drive our business. Profitability characteristics are very different between food sales and beverage sales. Within food sales the profitability of all the different meal periods as well as distinguishing the relationship between outlet sales and banquets is key. What would you rather have, dinner revenue increase or the same revenue increases from coffee breaks? Would you like to see sales increase in your outlets or in banquets, what would have a bigger impact on profit.? With beverage sales, the profit margins for liquor, beer and wine need to be understood as well as the portion from our outlets vs banquets. When we look at the average cover prices in food we also need to understand the contribution margin. It’s nice to see the average cover increase but what profit do I make from the different type of sales inside my F&B operation? All of this looks complicated on the surface but it really is not. With a little analysis and some patience, we can build a model that will help us see the optimal picture for profitability in our F&B operation. With this picture, we can strive to create the optimal recipe for our food and beverage success. That’s the key, understanding what the optimal mix is and getting our sales and conference services people selling that. Getting our outlet managers and servers to understand what items have the biggest contribution to profit and have them sell accordingly. If we were selling cars, we would know model that generates the biggest margin, and the accessories that drive profits. Our business is no different. Flow thru and its impact is at the heart of understanding this profit model.
Minor operating department flow. Same principles as above, what is the difference in the top line and how much did we make in additional profits. This is valuable information for spa, golf and retail operations.
The last part is sometimes the most important, in this case its non-operating department flow. I can’t tell you how many statements I see where there is a nice hit on the top line revenues only to have most of the potential profits chewed up in non-operating departmental creep. Administration costs, sales and marketing and maintenance flow needs to be measured, and managed. If you cannot readily see this you’re missing a powerful tool.
Creating the flow thru measurements in your financials is relatively straight forward. Pulling out the numbers you want to see like the change in revenue and the change in profit from the two different periods and dividing the two is it. Display these on your financials and you will have a whole new understanding of your business and be much more effective in your ability to hold others to managing their departmental flow thru.
Mastering flow thru is the key to the hotel profit maximization. Understanding where we win and pointing the team, the sellers, the operators in that direction. Creating alignment around the business model.
For a complimentary copy of my excel sheet “flow thru cheat sheet” send me an email requesting a copy to [email protected] or visit my website and download my free guidebook, “the seven secrets to create a financially engaged leadership team in your hotel”. www.hotelfinancialcoach.com
Call or write today for a valuable consultation on how you can create more financial leadership in your hotel.