By David Lund
Do your hotel financial statements give you the information you need to effectively manage your hotel? Are you able to see if your profits are where they should be in an enhanced top line statement? Do your statements measure flow thru? Do you record your rooms business by proper segments and track the rooms occupied, rate and revenue in each segment? Do you record customers served in F&B and do you separate meal periods? Do you record liquor, beer, wine and mineral sales on your financials separately? Do you measure labor productivity in your financials? Do you record hours of work in your financials? Do you have payroll segmented by management and hourly classifications? Do you have a separate supplemental payroll and benefits statement? Do you track arrivals and departures? Most statements I see do not have most of these critical elements included. They’re lacking these incredibly effective items that can easily be added. Most people use the standard format as outlined in the 11th addition of the uniformed system of accounts for the lodging industry. This is great however you can produce an enhanced statement with just a little more detail added that will greatly assist you in effectively managing your hotel.
How would these elements add insight and value to your business? Let’s explore this.
In part one we covered the Top Line Statement format, Flow Thru, Rooms Segmentation, F&B Customers and Average Checks by Meal Period. If you missed part one check out my website and blog post from February 27th, 2017, to get the article.
Measuring Productivity on Your Financial Statements.
The only truly effective way to measure labor productivity in the hotel business is by expressing the productivity in hours per room occupied in the rooms division, hours per cover served in the F&B division and EFTE’s per 100 rooms available in the non-operating departments. In this article, we will concentrate on Rooms and F&B productivity. The reason why hours per is the best way to measure productivity is we divide actual hours worked by the actual volume of business, units sold. Others may say that measuring labor percentage, or dollars of labor per unit sold are effective but the fact is our managers and leaders have no control over wage rates, but they do have control over hours worked, the schedule, and this is what we want them to focus on. Being able to see the hours worked and the number of rooms or covers served in our financial statements means we need to record and book these statistics monthly in a statistical journal entry. We accomplish this by adding a “stats” department to our chart of accounts and the statistical entry and department net to a big fat zero each month.
The beauty of knowing the hours per room occupied is powerful stuff. If we were making cars we would want to know how many hours of work it takes to make a car. We would then want to innovate and find ways to reduce this. In the hotel, it’s the same. We split off the rooms and F&B because they are very different. In the hotel business, we want to know how many hours it takes to service one room or one cover. We then want to innovate to see if our malmanagement practices are actually producing better or worse results and adjust accordingly. The only way to do this is with hours per calculations.
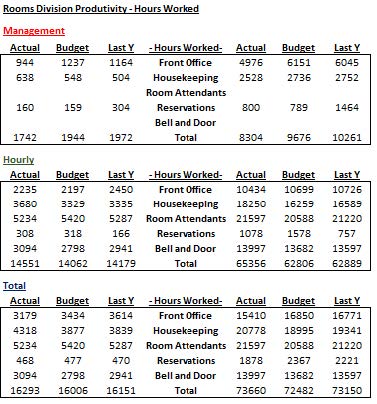
In rooms, we want to be able to see the hours it takes to service one room. We want to be able to break that down between the front office, guest services, housekeeping, room attendants, and reservations. We also want to be able to distinguish the hourly and management hours worked. Once we have the hours recorded by area in hourly and management we divide the hours worked by the rooms occupied. So, for example, YTD the front office hourly total is 10,434 hours worked and management is 4,976 hours worked.
The rooms occupied are 41,975. To figure out the productivity I divide the hours worked by the rooms occupied. My productivity is .249 for hourly and .119 for management. I do this with each classification of payroll monthly and YTD, for all three financial categories; actual, budget and last year. Below is a chart the shows the complete rooms division picture. Quickly we can see if we have better or worse productivity compared to budget and last year. An increase in our productivity will mean my numbers go down. Why would I hire you to run my housekeeping department if you’re going to be less productive than the last manager? I want you to continually strive to improve productivity and the only way I can measure this is by hours worked divided by rooms occupied. We want to include all rooms occupied and all hours worked. Over time hours count as one hour. We do not include hours for holiday pay or vacations, these are nonproductive hours.
In this example were looking at an average hotel and it’s the May results and YTD May. The left side is the summary of hours worked and on the right side, it’s those hours divided by the rooms occupied which are at the very bottom of the chart on the right side.
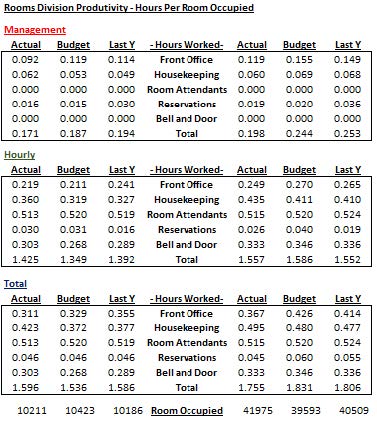
From this simple analysis, we can clearly see where we’re improving and where we are falling in the rooms division for the month and YTD relative to budget and last year with labor. We can see this by area and by hourly and management position. In this example, management in the front office, housekeeping, and reservations have had positive productivity changes. With the hourly, we see improvements in the front office, room attendants, reservations, and bell desk. Overall the YTD productivity is 1.755 hours per room occupied compared to the budget of 1.831 and last year of 1.806. Let’s now look at the impact this has on the hotel. Comparing the YTD productivity to last year we see that it has improved from 1.806 hours per room occupied to 1.755 hours YTD this year. To measure the impact, we just need to subtract the two and multiply by the YTD rooms occupied. In this hotel, the wage rates with benefits are $30. (1.806-1.755 = .051) x 41975 rooms occupied = 2140 less hours worked x $30 = $64,221 in labor savings YTD after May. If the trend continues we will save over 150k by year end.
The chart and the analysis are great tools but the most useful piece of this is understanding what changes were made that created the enhanced productivity. From there we want to see how these ideas can be extrapolated to our other hotels. One of the chief by-products of this type of analysis is benchmarking all the operations in our portfolio so we can see what hotel is best and in turn discover their practices and apply them wherever possible and practical to our other hotels. Brands sell expertise to owners and without productivity measurements in the financials, brands and hotels don’t know if they are improving or not. A percentage will not tell you as it’s a percentage of something else, usually revenue and this can be very misleading.
The food and beverage department productivity analysis is the same but uses F&B hours by area and covers. In F&B we need to organize things a little differently due to the various outlets and kitchens. We want to record direct service for each outlet using hourly and management as well as allocated hours for management, kitchen and stewarding.
Separate Schedules for Supplemental Payroll and Payroll Benefits
Having these two additional costs separated and summarized on a separate schedule is both very handy and useful. These costs are usually allocated to each department using hours worked or some other allocation basis. To be able to see them in total is critical. Without the totals, we don’t know the overall picture relative to budget and last year. This schedule can be created quite easily and it’s important that we distinguish between supplemental payroll which is defined by costs that are directly related to the payroll. Examples are vacations, statutory holidays, sick pay, bonus, severance. On the benefit side, we want to include items like state and federal programs, health care, cafeteria costs, worker’s compensation, and pensions. Both of these categories are big dollars to a hotel and their characteristics are different so having separate reporting that summarizes them is very important.
Tracking Arrivals and Departures and Average Guests Per Stay
I once had a hotel in my region that had an average length of stay of 13 days. Needless to say, this hotel was unique. On the other side of that, I also know an airport hotel that has an average stay of less than 1 day. This statistic allows us to measure the amount of activity for the bell desk and front desk as well as the demand on the room attendants as stay overs are easier to clean than departures. Stay overs mean no additional work for the front desk, door or bell desk. The average length of stay also can point to early or delayed capital needs for everything from the room renovation to the carpets and other operating equipment. A general rule of thumb in rooms is, the higher the average length of stay the better the labor productivity should be. This statistic is calculated by dividing the number of rooms occupied by the arrivals. Finally, were wanting to measure and see the average number of guests per stay. We can achieve this by recording the number of guests in the room and dividing the aggregate of these by the total number of rooms sold. This is particularly useful for measuring F&B capture and it also points to linen and amenity consumption. Typically, the lower the number of guests the lower the laundry and amenity costs per room occupied.
Visit my website today for a copy of my guidebook, The Seven Secrets to Create a Financially Engaged Leadership Team in Your Hotel. www.hotelfinancialcoach.com