|
Investment Report Colliers International Hotel Realty 2000 |
 |
| Colliers International Hotel Realty is pleased to present its fifth
annual report on the Canadian Hotel Investment Market. The report highlights
the Colliers Hotel Value Index, recent additions to supply and hotel projects
currently under construction; market occupancy, average room rate and RevPAR
trends; and historical transaction volumes by market.
Our Index has Changed
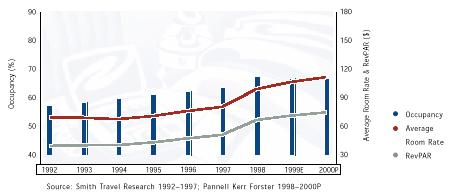
To provide market trend projections, we have used data compiled by Pannell Kerr Forster for the years 1998, 1999 and 2000. Throughout the report, 1999 occupancy, average room rate and RevPAR results are stated as estimates based on actual results year-to-date October and knowledge of specific market trends. We have continued to use the data provided by HVS International and Smith Travel Research for the prior years. Where Are We in the Hotel Investment Cycle? Nineteen-ninety-nine was a year of mixed results for the Canadian hotel investment industry. While it was marked by strengthening occupancies, rates and profitability, virtually across the country, transaction activity almost came to a standstill. In the fall of 1998, there was speculation that the United States economy could enter into an economic recession, while at the same time the Asian meltdown would escalate. Thankfully, neither of these events transpired and most Canadian hotels enjoyed record profits. Nationally, RevPAR (chart) grew by 6.8% over last year, from $67.12 to $71.69, which according to Pannell Kerr Forster suggests the percentage increase in Income Before Other Fixed Charges should be in the 10% to 15% range. Our congratulations to the prudent investors who acquired hotels between 1992 and 1995, as your current operating performance is most likely exceeding original five-year projections. Despite this good news scenario, the hotel investment and financial communities were marred by the perceived threat of an economic downturn and became reluctant providers of debt and equity capital. As well, many buyers compared this point in the investment cycle to the peak in 1989, believing the market would dramatically fall in 1999. However, the cycle differs today as hotels are generally far less leveraged than in the previous decade and pricing, while stabilizing or declining in many markets, remains at or below replacement cost. More importantly, with the exception of Vancouver and Calgary, the threat of supply imbalance does not exist unlike many markets in the United States. Wall Street lost interest in the lodging industry in late 1998, and
this sentiment continued through 1999. Although Canada did not experience
a decline in RevPAR due to an abundance of new room supply. Wall Street
sought other industries with greater returns. For instance, the
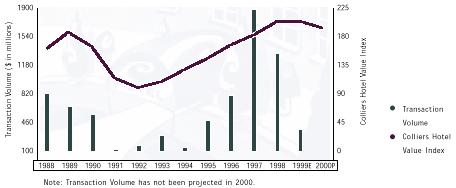
New Room Supply (chart) The most dramatic increases in room supply, from 1998 to those projects currently under construction, occurred in Calgary with a total of 2,069 new rooms (24.1% supply increase), followed by Vancouver Downtown (15.3%) and Vancouver Airport (57.5%), which witnessed 1,612 and 1,563 new rooms, respectively. With these exceptions, we estimate most Canadian markets could with-stand supply growth of between 5% and 10%. GDP growth remains strong throughout most of Canada, and th resultant demand from a strong economy should have a positive impact on market occupancies and rates. For example, the downtown markets of Toronto and Montreal have shown virtually no supply growth over the last two years, while achieving double digit RevPAR increases. Although there are a number of proposals being discussed and market fundamentals are at an all-time high, virtually no hotel projects are in the ground in these markets. Quite simply, the ability to finance a hotel with an appropriate amount of leverage remains difficult. Cost of Financing When available, the cost and level of financing was another major hurdle for hotel investors in 1999. As recent as a year and a half ago, qualified hotel buyers could finance a hotel asset in the 7% to 7 ¼% range, with a loan to value up to 65%. Despite strong operating fundamentals, the cost of financing has increased and is now typically in excess of 91/2 %, with loan to values closer to 50%. This increase in the cost of financing continues to negatively impact hotel values. As yield expectations continue to grow, the only variable to maintain investor returns is the price of the hotel asset. As a result, we are forecasting hotel values to stabilize or decline in most markets. Cap Rates (chart) Cap rates have steadily increased over the last several years due to improved market conditions. In 1993, the market cap rate was about 4.1%, reflecting the turn-around and repositioning prospects of the hotels being acquired at the time. Many of these properties were purchased at relatively low prices per room as they required significant capital upgrading and repositioning; how-ever, the yield was also low. Cap rates rose to 10.6% in 1997, before falling by sixty basis points in 1998, to 10.0%. This 600 basis point spread from just five years prior was a true reflection of the buyer frenzy taking place in the public markets, which resulted in transaction activity reaching $1.3 billion in 1998�the largest turnover in the history of the Canadian hotel industry. With contin-ued market growth throughout 1999, cap rates reached 11.1%, up over a percentage point over the prior year. There are indications that the hotel investment market is active; however, with limited upside repositioning opportunities, higher yield returns on hotel assets are being sought. Buyer Profile With 1998 characterized as the year of the REITs, 1999 was certainly the year of the private capital source as it represented approximately 90.0% of the transaction volume. The lack of acquisitions by the REITs, follow-ing combined investment activity of $423.5 million in 1998, clearly suggested that these companies would only acquire hotels if the deals were accretive and provided double digit rates of return. At the time of printing this Report, estimated 1999 yields reported by the Canadian hotel REITs ranged from 11.5% for Legacy to 21.7% for Royal Host. This was compounded by the unavailability of debt and equity capital that had previously spurred the tremendous growth of these entities. On the Horizon You will note, we have revised our 1999 growth rates in the Hotel Value Index from our last report. The path to regain Wall Street�s confidence in the lodging industry has taken longer than most experts anticipated, particularly in light of the industry�s strong operating fundamentals. Our 1999 estimates were aggressive as we believed it was likely that increases in hotel values would continue in 1999. With hotel operating fundamentals strengthening in the United States and Canada, and continued economic growth forecasted for North America, it is anticipated that there will be renewed interest in the hotel invest-ment market in 2000. As owners of multiple properties begin to rationalize their portfolios, we predict more hotels will be available for sale in 2000. We anticipate some of the Canadian public hotel entities will begin to prune their portfolios and concurrently look for more strategic opportunities that fit their investment criteria. American and Canadian private capital will continue to dominate the market.
National Overview
The Conference Board of Canada estimated pleasure travel increased by 2.3% in 1999 and will increase by a further 2.2% in 2000, while business travel grew by 2.9% in 1999 and will see a further 2.4% increase in 2000.
  The information contained herein has been obtained from sources deemed reliable. While every reasonable effort has been made to ensure its accuracy, we cannot guarantee it. No responsibility is assumed for any inaccuracies. Readers are urged to consult their professional advisors prior to acting on any of the material contained in this report. All data was confirmed and cross-referenced by Colliers International Hotel Realty. |
|
Colliers International Hotel Realty Deborah Borotsik One Queen Street East, Suite 2200 Toronto, Ontario Canada MSC 2Z2 [email protected] http://www.colliers.com |