advertisement
|
News for the Hospitality Executive |
advertisement
|
Hoteliers Score
Business with Sports Groups
By: Eric B. Hansen, AIA, ISHC May, 2013 After numerous and varied
experiences while traveling personally for youth sports events and
completing several recent feasibility studies for hotels and resorts
with sports facilities, it is clear that the relationship between the
sports travel industry and the hospitality industry is significant. In
order to understand this relationship, trends in sports participation,
with particular attention paid to trends in sports spending, need to be
analyzed. Weekday versus weekend group demand at hotels and the sports
group consumer’s attitude toward the entire ‘travel-for-tournament’
experience are important issues in preparing a hotel feasibility study
or a sports facility feasibility study.
TRENDS IN SPORTS PARTICIPATION Each year, the Physical Activity Council (PAC) produces a Sports, Fitness and Leisure Activities Topline Participation Report that is a result of the partnership of six major trade associations within the U.S. sports, fitness, and leisure industries. Each association partner produces detailed data on its specific areas of expertise, and submits its overall participation data to this “topline” report. These six associations are the International Health, Racquet and Sportsclub Association (IHRSA), The National Golf Foundation (NGF), The Outdoor Foundation (OF), The SnowSports Industries America (SIA), The Sports and Fitness Industry Association (SFIA) and the Tennis Industry Association (TIA) in collaboration with the United States Tennis Association (USTA). The major focus of the report is to “establish levels of activity and identify key trends in sports, fitness and recreation participation in the U.S.” Hotel & Leisure Advisors is a member of the Sports and Fitness Industry Association (SFIA), which publishes various research reports. According to the recently released 2013 Sports, Fitness and Leisure Activities Topline Participation Report, 28% of the population of Americans age 6 and older are inactive, meaning that 72% of Americans are active. The report breaks down the number of active Americans based on low- to high-calorie activities and beyond. The results of the study indicate a figure of 33% of Americans or 94.8 million individuals age 6 and older are active to a healthy level and beyond. Who among the 94.8
million are most likely to travel for sports on the weekends and
require lodging accommodations? This demographic includes those who
participate in team sports, and typically those who are identified as
“core” participants. A core participant is an individual who engages in
his/her particular sport at a higher level than casual play. The core
participant includes the regular and frequent player. The industry
definition of what constitutes a core participant varies with each
sport. The following chart identifies growth rates in various team
sports for core participants.  Out of the 24 team sports where participation is tracked by the SFIA, nine have achieved positive average annual growth rates across the five-year period. A total of 15 team sports achieved positive growth rates in 2012 over 2011. Of the team sports with more than a million participants, most notable increases were achieved in cheerleading, ice hockey, fast pitch softball, and beach volleyball. Participation growth has been trending positive in all the team sports with less than a million participants, including field hockey, lacrosse, roller hockey and rugby, identifying these sports as potential growth areas. The above chart is a snapshot of the entire United States. Within certain geographic locations, the growth trends for a particular sport can vary greatly. A site-specific study can determine the strongest growth trends for a particular team sport in a given region. For example, the Middle Atlantic region is a hotbed for the sport of lacrosse, capturing more than 45% of all lacrosse participation in the U.S., according to the SFIA. TRENDS IN SPORTS SPENDING Spending patterns
related to sports, fitness, and leisure activities are another key
component to understanding the relationship between the hospitality
industry and the sports travel industry. The 2013 Sports, Fitness
and Leisure Activities Topline Participation Report profiles
spending trends in 12 categories. Of interest to hoteliers are the
categories of spending in “Team Sports Outside School” and “Travel to
Take Part in Sports & Recreation.” These two categories match the
profile of the sports participants who engage in their sport with
enough frequency and dedication to travel beyond their home area to
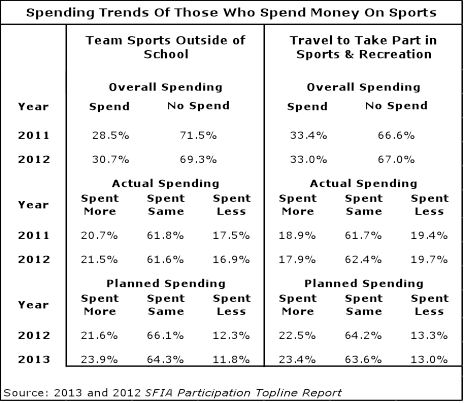
participate. The following chart identifies the spending trends of
those who spend money on sports in these two categories.
The percent figures shown in the categories of actual spending and planned spending are based on the percent of overall spending; i.e. the percentage figures reflect only those that actually spent or planned to spend money on sports. Over the two-year period, overall spending for “Team Sports Outside of School” increased from 28.5% to 30.7%. This increase was the direct result of participants spending more in 2012 than they did in 2011. This category includes club play with potential year-round commitments. In the category of “Travel to Take Part in Sports & Recreation,” the overall spending between 2011 and 2012 decreased slightly from 33.4% to 33.0%. Statistically, this is considered “flat.” This decrease was reflected in minimal decreases in two of the three spending categories. Forecast trends for 2013 indicate planned increases in spending for both categories. Considering trends in both team sport participation as well as spending, the future for core sports participants to spend money outside their local community on items such as lodging accommodations is promising. Recent interviews for feasibility studies our firm has conducted reveal parents with child athletes recognize trends toward sports specialization early on with increased levels of commitment to participate in club and travel-related programs. Parents are providing better experiences for their child athletes than they had themselves. LODGING DEMAND FOR SPORTS GROUPS While local league play provides for the majority of revenue at a sports complex or venue, a significant source of additional revenue can be made through the offering of tournaments and showcase events. It is through these events that sports group demand is generated for the local lodging accommodations. Tournaments and showcase events are typically multiday events that have a broad economic impact on a particular area and/or region. The National Association of Sports Commissions (NASC) was established in 1992 as the lead association for the sports travel industry. As its mission the association “provides an outlet for communication between sports commissions, CVBs, event rights holders, and suppliers to the sports and travel industry.” According to the NASC’s 2012 Report on the Sports Travel Industry, there is a synergistic relationship between sports commissions and CVBs because sports commissions “are interested in attracting and producing sports events” while CVBs place more importance on the generation of room nights. These two types of organizations work hand in hand. With more than 600 organizations as members of the NASC, the sports travel industry is big business. Many of the CVBs that we have interviewed across the country either work with their local sports commissions (if they exist) or leverage their region’s specific inventories of sports venues and amenities to address the needs of the sports industry from a tourism point of view. Those hotel properties that do not embrace the sports tourism market are missing out on potential revenue that if managed properly can be a significant source of a hotel’s success. Hotel & Leisure Advisors’ research of lodging demand for sports groups indicates that significant compression occurs centric to the sports venue hosting the event. Booking rooms at properties more than 45 minutes from the tournament venue in order to accommodate a large block of rooms is not uncommon. Many tournament organizers will arrange packages with preferred hoteliers providing ease of booking and coordination for tournament participants and their families. The manner (room rebates, stay-to-play, etc.) in which local hotels are engaged in the sports travel industry is a discussion beyond the scope of this article. Another key aspect to sports group demand is that the typical weekend youth sports participant is traveling with his/her parents as well as siblings. The opportunity exists to capture more per capita spending at a property through its food and beverage and sundry outlets. Some hoteliers we have interviewed have reported that the sports group market is not a good fit for their properties, and the weekend youth that arrive and depart are more of a hassle than they are worth. However, our research shows that hotels can gain occupancy points and additional departmental revenue from sports groups. THE SPORTS GROUP LODGING EXPERIENCE Sports group consumers are prudent spenders. Like other typical consumers they seek the best deal available to make their discretionary purchases last. Sports group consumers are also seeking more than just a hotel room. Many parents who have made the decision to travel for their child’s sport activities also take the opportunity to view the weekend travel as a mini vacation, and don’t necessarily want the rock-bottom experience. Both limited-service and full-service properties have amenities and offerings that when tailored to the expectations of the sports group consumer result in travel experiences that are memorable. Successful hoteliers in the sports group market recognize the weekday-weekend shift that occurs in hotel operations due to having a sports team on property. Our interviews with hoteliers and the sports group consumer reveal several interesting issues that are central to the relationship between the sports group consumer and the lodging property.
The points of consideration outlined above are those that have risen to the top in our research and feasibility studies within the sports group market. It is not only the hotel experience, but the overall local experience that plays a role in determining future participation in a specific sports tournament or event. SUMMARY While not as
experienced as typical corporate travelers, sports group consumers are
becoming more sophisticated when it comes to desired amenities from
their lodging accommodations. It is important to embrace sports group
consumers in a manner that will keep them coming back year after year.
The trend in traveling for youth sports events will likely continue to
increase because parents with dedicated and committed athletic children
are now engaged on a year-round basis with their child’s primary sport.
Hoteliers who recognize these sports participation trends can achieve
higher revenue and attract new demand segments. About the Author
Eric B. Hansen, AIA, ISHC is the Director of Development Services for
Hotel & Leisure Advisors, a national hospitality consulting firm.
Mr. Hansen is active in preparing appraisals, market feasibility
studies, economic impact studies, property condition assessments, and
impact studies for hotels, resorts, waterparks, sports facilities, golf
courses, conference centers, and other leisure properties. Mr. Hansen
offers more than 18 years of experience in the hospitality industry. As
a hospitality consultant with a foundation in consulting, architecture,
financial management, and appraisal theory, Mr. Hansen brings well
rounded expertise to various H&LA assignments and assists H&LA
clients with their pre-development, consulting, and valuation needs.
|
| Contact: Eric B. Hansen, AIA, ISHC or David J. Sangree, MAI, CPA, ISHC President Hotel & Leisure Advisors, LLC 14805 Detroit Avenue, Suite 420 Cleveland, Ohio 44107-3921 Phone: 216-228-7000 Fax: 216-228-7320 Email: [email protected] Website: www.hladvisors.com |
| Also See: | Waterpark
Resorts Supply and Demand 2013 Update / David J. Sangree / January
2013 |
| Weight
Loss Resorts Are A Boon for Developers / David J. Sangree &
Laurel A. Keller / September 2012 |
|
| How
to Perform a Feasibility Study for Indoor and Outdoor Waterpark Resorts
/ David J. Sangree, MAI, CPA, ISHC / July 2012 |
|
| Season
Pass Price Positioning for Outdoor Waterparks / David J. Sangree,
MAI, CPA, ISHC / February 2012 |
|
| Ten
Largest Hotel Brands' Average Sale Prices / David J. Sangree, MAI,
CPA, ISHC / October 2011 |
|
| The
Lodging Market is Improving in Ohio’s Big Cities; A Close Look at
Cleveland, Columbus, and Cincinnati / David J. Sangree, MAI, CPA,
ISHC and Joseph Pierce / September 2010 |
|
| Cleveland's Second Wind: 2008 Hotel Industry Overview / Hotel & Leisure Advisors / September 2008 | |
| Ohio’s Lodging Market: Historical Analysis & 2006 Forecast / David J. Sangree, Laurel A. Keller, and Joseph Pierce / March 2006 |