advertisement
|
News for the Hospitality Executive |
advertisement
|
Ten Largest Hotel
Brands' Average Sale Prices
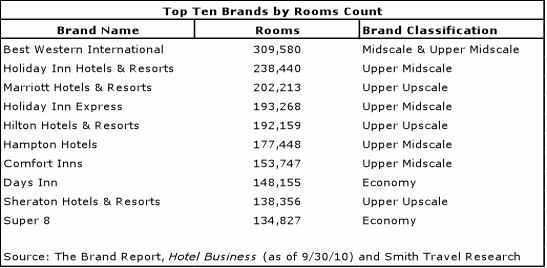
By: David J. Sangree, MAI, CPA, ISHC as published by Hotel News Now, September 2011 Summary: Hotel & Leisure Advisors has accumulated a database of more than 6,000 hotel sales since 2000. This article analyzes the average hotel sale prices per room for the major brands in the hotel industry. Our comparison includes top 10 brands by room count. It includes nearly 3,000 transactions between January 2007 and August 2011. Our analysis indicates that the Hilton Hotels and Resorts brand achieved the highest mean and median sale price per room of the top brands by room count in the United States, while the Days Inn brand achieved the lowest mean and median sale prices per room. Premise of the Study: We have
utilized sales from 2007 to 2011 within our sales database to present
the mean, median, high, and low sale prices per room for the top ten
brands with the greatest number of rooms in existence in the United
States. These brands were chosen from “The Brand Report” published by
Hotel Business. The following table displays the brands, their room
counts, and the brand classification as defined by Smith Travel
Research.
Sales Analysis: The results of data aggregation within our system are shown in the following chart. The minimum sample size for each brand was 40 sales transactions. The chart displays sales with prices before any planned renovation that may have taken place at the individual property. 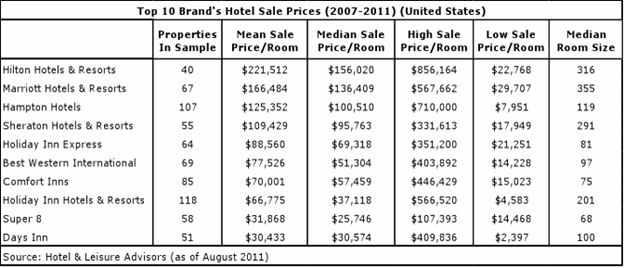 The analysis reveals various trends of the property sale prices of the ten largest brands. The average sale prices mostly correlate with the quality ranking of each of the brands as measured by Smith Travel Research, AAA or other travel ranking services with a few exceptions. The Hilton and Marriott brands recorded the top two rankings on the average sale prices. They both represent full-service upper upscale brands. Surprisingly, Hampton hotels achieved the third highest ranking despite being an upper midscale limited-service property type. Days Inn and Super 8 both represent economy brands and not surprisingly achieved the lowest mean sale prices. The following describes each of the brands and conclusions. Hilton Hotels & Resorts had the highest mean and median per room values in our sample. This upper upscale brand included a number of sales in major urban markets including New York City where hotels typically sell for higher per room values. Only a handful of transactions fell under $100,000 per room within the brand. That is a testament to the consistent and strong quality levels that the brand maintains, which allows for a higher sale price per room. This brand had fewer distressed sales over the past two years than other brands. Marriott Hotels & Resorts had the second highest per key value. This upper upscale brand is also typically located in major urban markets that achieve higher prices per room. The mean and median values per room for Marriott property sales were quite close. The tighter price spread of sale prices per room reflects the strict brand standards imposed by Marriott and the generally well maintained properties. Fewer Marriott properties were sold as distressed assets when compared to the general hotel market. Hampton Inns and Inns & Suites were one of the 'stars' of this data sample. While its hotels are of a limited-service concept, its properties sold for much greater values than even some full-service hotels. This speaks to the strength of the brand in general and the brand’s strictly enforced requirements to maintain and renovate the properties. As far as the range of sales goes, the low and high sales are truly outliers. The highest sale price shown of a Hampton Inn was from a sale in New York City while a majority of the Hampton sales were located in suburban markets. Sheraton Hotels & Resorts showed a mean per key value of $109,429. This upper upscale brand has implemented major renovation projects throughout the brand, which has caused some properties to leave the system and other properties to implement large product improvement plans upon sale. The sale prices shown reflect the prices prior to any renovation estimates. Sheraton Hotels have sold in both urban and suburban markets. Holiday Inn Express represents a limited-service upper midscale brand that sold for per room values near to and greater than other property types offering more numerous amenities. The strength of the brand is due to strong consistency of its hotels, which require fewer renovations. Holiday Inn Express had a fairly wide spread of hotel values due to the properties being located everywhere from major urban markets to highway rest stops and more rural areas. The economic downturn caused the spread to widen, as our data set ranges from 2007 to 2011. Best Western is the largest brand by number of hotel rooms and includes properties in both the midscale and upscale segments. Best Western has properties in various rural, urban, and suburban markets. This is the only membership-based brand of the top 10 brands, and allows its hotels more flexibility in design than some of the other major brands. This is apparent since the brand had a mean sale price of $77,526 per room yet still a very wide spread to its sales prices per room. Comfort Inn represents the largest brand owned by Choice Hotels International and is defined by Smith Travel Research as an upper midscale brand. Our sample includes 10 transactions above $100,000 per room located in urban markets including two located in New York City, which sold for over $400,000 per room. The majority of sales of Comfort Inn properties were below the mean sale price of the brand. Holiday Inn Hotels & Resorts represents one of the oldest franchise hotel brands in the United States and is considered by Smith Travel Research as an upper midscale brand. This brand achieved the highest number of sales over the four-year time period. This has occurred partially because the brand is going through a major transition. Intercontinental Hotels Group has been requiring owners to renovate their properties to improve the overall consistency of the brand. A number of Holiday Inn properties changed franchise affiliations upon sale. The sale prices are lower as the buyers anticipated having to spend additional renovation costs (not included in the recorded sale prices). Super 8 is one of two Wyndham brands included among the top 10 hotel brands in the United States. This brand had a very tight spread of sales due mainly to the fact that economy properties do not see as wide a price range per room for their hotels as more upscale properties. Additionally, these properties have more suburban and rural locations with few urban hotels utilizing this hotel franchise. Days Inn represents one of the older franchise hotel brands in the United States and is also a Wyndham brand. The Days Inn brand experienced similar results to the Super 8 brand. This brand had one of its properties sell for the lowest sale price per room of any of the top 10 brands. The brand had mean and median values that are very close, which attests to the fact that Days Inn’s per room values are highly concentrated in the less than $50,000 per room range. Conclusion: Our study of brand values for the top 10 brands in the United States, indicates a wide range of historical sale prices over the time period between 2007 and August 2011. Not surprisingly, our study indicates that the higher the brand quality level, typically the higher sale price per room. However, certain brands such as Hampton have been able to maintain a higher sales price range per room than many full-service brands despite being in a limited-service brand segment. The higher sale price per room of the Hampton brand correlates with the above average RevPAR market penetration rate which the brand achieves as compared to other limited-service brands. Author David J. Sangree, MAI, CPA, ISHC is President of Hotel & Leisure Advisors, a national hospitality consulting firm. He performs appraisals, feasibility studies, impact studies, and other consulting reports for hotels, resorts, waterparks, golf courses, amusement parks, conference centers, and other leisure properties. He has performed more than 1,000 hotel studies and more than 200 indoor and outdoor waterpark resort market feasibility and/or appraisal studies across the United States and Canada. Mr. Sangree received his Bachelor of Science degree from Cornell University School of Hotel Administration in 1984. He became a certified public accountant in 1989. He became an MAI member of the Appraisal Institute in 1995 and a member of the International Society of Hospitality Consultants in 1996. Since 1987, Mr. Sangree has provided consulting services to banks, hotel companies, developers, management companies, and other parties involved in the lodging sector throughout the United States, Canada, and the Caribbean. He has spoken on various hospitality matters at seminars throughout the United States and on Good Morning America and CNBC. The author wishes to thank Mike Erlingis, our 2011 summer intern from Michigan State University's School of Hospitality Business, for his assistance on the article. He can be reached at 216-228-7000, ext. 20, or [email protected]. |
| Contact: David J. Sangree, MAI, CPA, ISHC President Hotel & Leisure Advisors, LLC 14805 Detroit Avenue Suite 420 Cleveland, OH 44107 Phone: 216-228-7000 ext. 20 Fax: 216-228-7320 Email: [email protected] Web: www.hladvisors.com http://www.linkedin.com/in/davidsangree |
| Also See: | The
Lodging Market is Improving in Ohio’s Big Cities; A Close Look at
Cleveland, Columbus, and Cincinnati / David J. Sangree, MAI, CPA,
ISHC and Joseph Pierce / September 2010 |
| Cleveland's Second Wind: 2008 Hotel Industry Overview / Hotel & Leisure Advisors / September 2008 | |
| Ohio’s Lodging Market: Historical Analysis & 2006 Forecast / David J. Sangree, Laurel A. Keller, and Joseph Pierce / March 2006 |