![]()
advertisement
.
Chicago Luxury Hotel Market: When Will the Pain End
.
|
News for the Hospitality Executive |
![]()
advertisement
.
Chicago Luxury Hotel Market: When Will the Pain End
.
| October 2007 - Hunden Strategic Partners conducted an analysis
of the Chicago luxury market as part of its ongoing industry-related research.
Especially in the current economic climate, it is instructive to understand
how the best hotels are faring, the impact of recent additions to supply
and the prospects for future entrants.
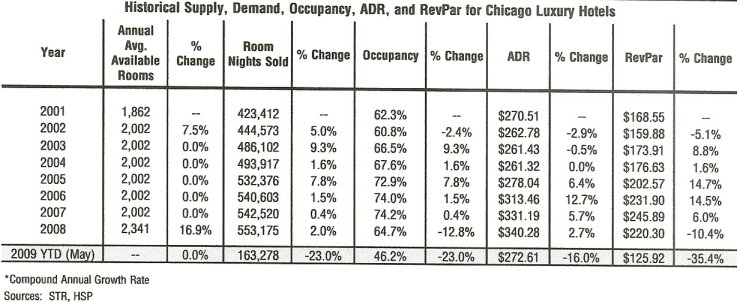
The table below shows the current luxury set.
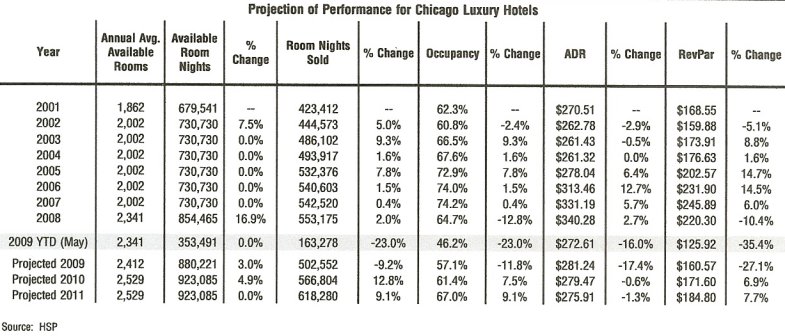
Supply Changes. The Trump International Hotel reported its first month of results in January of 2008. This was the first new luxury hotel to open in the market since the Peninsula opened in 2001. The 339-room property represented a 17 percent increase in luxury supply. During its first six months, occupancy in the set ranged from a decline of 22 percent (February 2008) to an increase of 1.5 percent (April 2008), averaging a decrease of 9.7 percent. This indicates that while the market was weakening, it was able to absorb approximately half of the new supply without detrimental occupancy impact. The set�s occupancy decline related to the financial crisis began in earnest in November (discussed more below). Average daily rate for the set increased at an average monthly rate of 6.7 percent during the first six months of 2008 and continued to increase until November of 2008. This indicates that the luxury market was still exhibiting enough strength until November, despite new supply, to support rate increases. Another new hotel seeking to enter the luxury market, the Elysian Hotel & Residences, is expected to open in mid-August of 2009. With 188 hotel rooms (and 52 residential units), the reported $280-million project will represent an eight percent luxury supply increase. Given that RevPAR (revenue per available room) has continued to decline at double-digit rates, the timing for the opening of the hotel is difficult at best. This is somewhat similar to the opening climate for the Peninsula, as it opened in June 2001, just prior to the 49 percent luxury set occupancy decrease of September 2001 and the subsequent two-plus years of occupancy and rate difficulty. Luxury Set Performance Summary The table below shows key performance data for the luxury set through May of 2009.
Occupancy peaked in 2007 at 74.2 percent for the set. Despite a recessionary economy and an increase in supply of nearly 17 percent, occupancy declined by only 12.8 percent for the year. Average daily rate increased 2.7 percent to $340 in 2008 and RevPAR decreased by 10.4 percent. However, both occupancy and rate decreased at accelerated levels beginning in November of 2008 and continued through at least May of 2009. Year to date (compared to May 2008), occupancy has decreased 23 percent and rate has decreased by 16 percent, leading to a revenue decline year-to-date of 35.4 percent. The figure below illustrates the actual and 12-month moving average
for RevPAR, one of the key measures of hotel revenue.
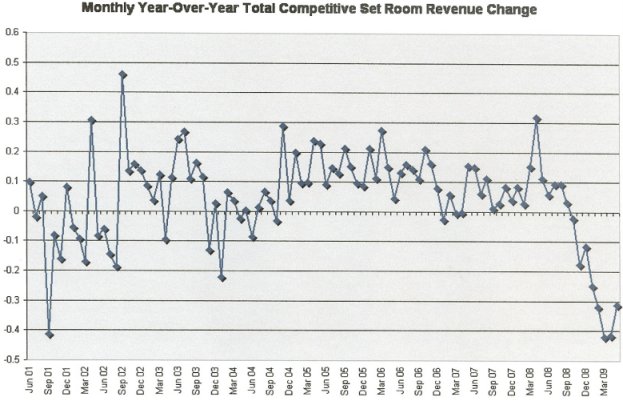
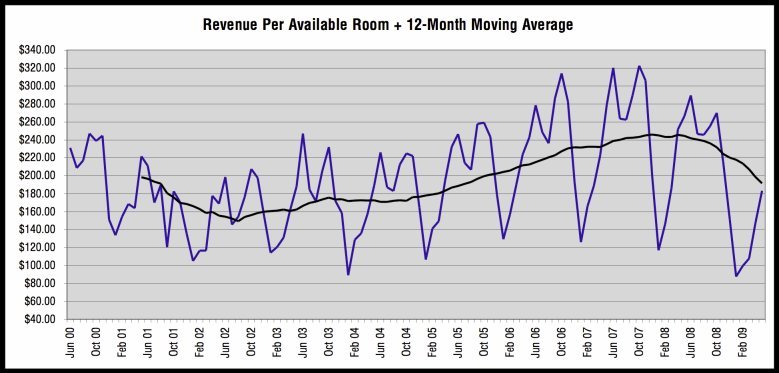 The figure below shows the year over year monthly room revenue change.
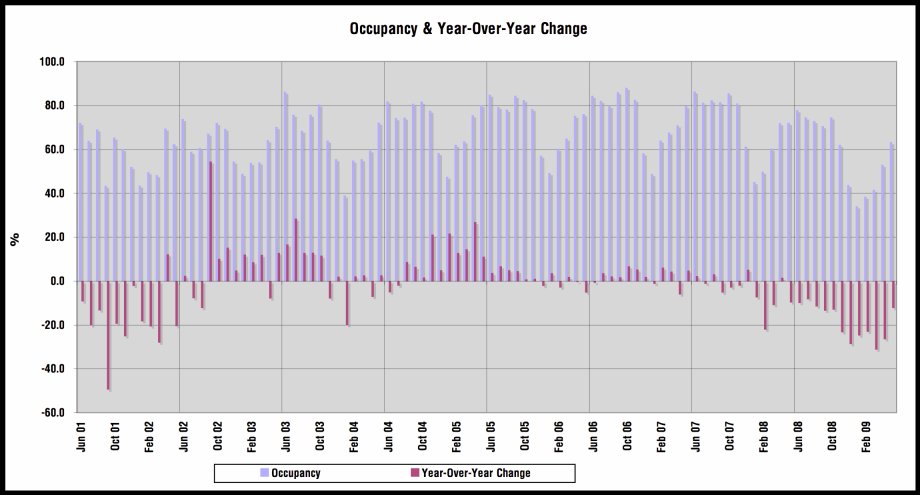
As the above graph indicates room revenue showed monthly increases on the prior year rom November of 2004 almost without interruption until September of 2008. Since then, the decreases have been increasing nearly continuously until April of 2009 when the declines stopped getting worse. If the present road to recovery is anything like the last, there will be false signs of great hope followed by several negative months. However, this cycle is not like the past in its descent, so it may not follow any model for recovery either. The figure below shows monthly occupancy and monthly (year over year) changes in occupancy.
The figure shows that the period from late 2002 through 2003 was a rebound from the lows of 2001 � 2002. The real occupancy growth to health occurred from late 2004 through late 2005, then essentially stabilized at a high level until early 2008, accelerating in late 2008. The figure below shows the minimum, average and maximum occupancy for the luxury set from 2001 through 2008.
Occupancy, on average, increases from a low of 50 percent in January to a peak of 80 percent in June, followed by strong summer and fall months. November is a shoulder month, while December through March average occupancies less than 60 percent. How is the luxury market expected to perform in the future? A look at the past cycle can be instructive. Absolute Peaks and Troughs The table shows the highest and lowest months for the key measures in the current and past cycles. 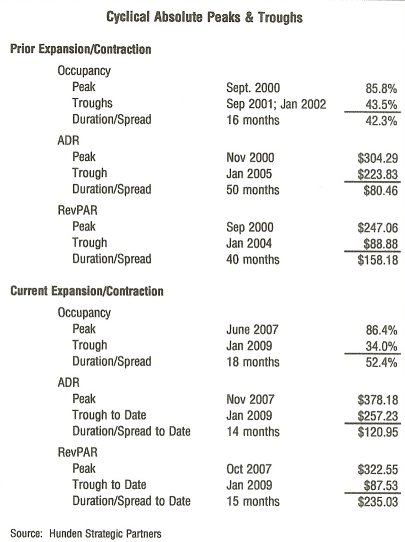
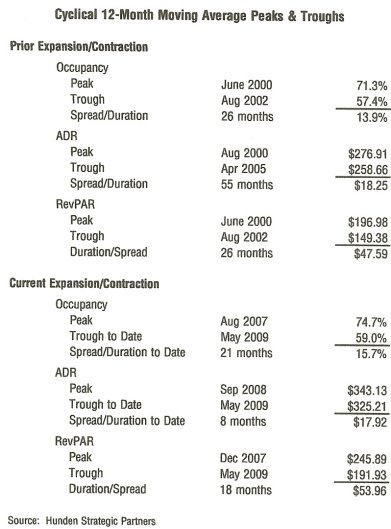
. The next peak in occupancy was in June 2008, at 86.4 percent, followed by the lowest occupancy recorded in the past ten years at 34.5 percent 18 months later in January of 2009. Average daily rate peaked in November of 2007 at $378.18 and its current bottom to date was in January 2009 at $257.23. RevPAR peaked in October of 2007 at $322.55 and bottomed out to-date in January of 2009 at only $87.53 (lower than the lowest RevPAR in the prior cycle). Overall, occupancy declined 52.4 percentage points from peak to trough and ADR declined $120.95 (or 32 percent off the high). RevPAR declined $158.18 from peak to trough (73 percent off the high). By all measures, the current hotel decline is more severe than the cycle. Yet to be determined is the length of this downturn, however, based on our models, January 2009 is projected to be the trough for monthly occupancy, rate and RevPAR. 12-Month Moving Averages: Peaks and Troughs A more rationale measure of performance is the 12-month moving average, which solves for extreme short-term variances. The table below shows the 12-month moving average of peaks and troughs for the current and prior cycle.
Looking at the 12-month moving average, the current expansion/contraction from this perspective has also shown more extremes than the last, despite the fact that the current cycle is not close to conclusion. In the last cycle, occupancy peaked at 71.3 percent in June of 2000 and bottomed out at 57.4 percent in August of 2002. The time between peak and trough was 26 months. Average daily rate peaked in August of 2000 at $276.91 and did not reach a low point of $258.66 until 55 months later in April of 2005. RevPAR, however, peaked in June of 2000 and bottomed out in August of 2002 (only 26 months). This lesser period of RevPAR decrease is due to the increasing level of occupancy even though ADR continued to decline. Overall, occupancy declined 13.9 percentage points from peak to trough and ADR declined $18.25 (a 6.6 percent decrease from the high). RevPAR declined $47.55 from peak to trough (26 percent off the high). The next peak in occupancy was in August of 2007, at 74.7 percent, followed by the trough to date of 59 percent 21 months later in the last month measured, May of 2009. Average daily rate peaked in September of 2008 at $343.13 and its current bottom to date was in May of 2009 at $325.21. RevPAR peaked in December of 2007 at $245.89 and bottomed out to-date in May of 2009 at only $191.93. Overall, occupancy has declined 15.7 percentage points from peak to trough-to-date and ADR declined $17.92 (or 5.2 percent off the high) from peak to trough-to-date. RevPAR declined $53.96 from peak to trough-to-date (22 percent off the high). As the 12-month moving average is expected to continue decreasing at least for the short term, this downturn is more severe than the last by moving average measures as well. Projection of Future Performance When will Chicago�s luxury hotel�s hit bottom? As shown by the prior
cycle, while occupancy may rebound quickly, until it reaches a certain
level, hotels have little power to increase rates. Once compression occurs
(individual months over 76 percent and moving average periods over 70 percent
occupancy), hotels will begin charging higher rates. The table below shows
HSP�s projection related to the trough in this cycle.
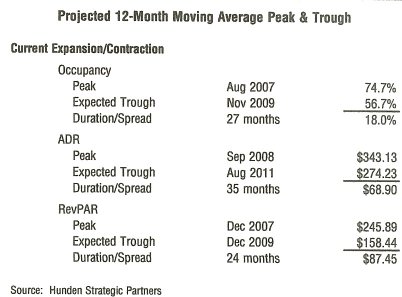
The 12-month moving average for occupancy is expected to bottom out in November of this year at 56.7 percent after a 27-month slide. Average daily rate is projected to take much longer to hit bottom, not increasing again until after August 2011 at $274.23. This is a decline of 20 percent off its peak. RevPAR is expected to bottom out in December of this year at $158.44, or a decline of 36 percent from its peak. While shorter in duration than the last cycle, this one is projected to be much more severe in every measure. Projection of Future Performance. Based on current available data and a number of assumptions about future macro and local economic trends, HSP presents its current projection of future luxury hotel performance for 2009 through 2011.
The addition of the Elysian will increase supply by 3.0 percent in 2009 and 4.9 percent in 2010. 2009 � The additional supply combined with the weak economy will contribute to the lowest annual occupancy in the last ten years, 57.1 percent. Average daily rate is expected to decrease by 17.4 percent from 2008 to $281.24 and RevPAR is projected to decline by 27.1 percent to $160.57. 2010 � A rebound in demand, as well as occupancy is expected to occur by 2010, which is expected to lead to occupancy of 61.4 percent for the year. This should help slow the decline in ADR, although not completely reverse it. Average rate for the year is projected at $279.47 (a decrease of 0.6 percent) and RevPAR is expected to increase by 6.9 percent to $171.60. 2011 � Increasing occupancy via additional demand is expected
to finally provide enough compression and price support to reverse ADR
declines by August of 2011. While not enough to erase the declines earlier
in the year, it will set the stage for a strong rate rebound in 2012.
|
| Contact:
Rob Hunden
|
.To search Hotel Online data base of News
and Trends Go to Hotel.OnlineSearch
Home | Welcome|
Hospitality
News | Classifieds|
One-on-One
|
Viewpoint
Forum | Industry Resources
| Press Releases
Please contact Hotel.Onlinewith
your comments and suggestions.