ARLINGTON, Va., May 6, 2009 - Interstate Hotels & Resorts
(OTC Bulletin Board: IHRI), a leading hotel real estate investor and the
nation's largest independent hotel management company, today reported operating
results for the first quarter ended March 31, 2009. The company's
performance for the first quarter includes the following (in millions,
except per share amounts):
First Quarter
2009(4) 2008(5)
------------- -------------
Total revenue(1)
$30.5 $38.9
Net loss
$(12.5) $(0.3)
Diluted loss per share
$(0.39) $(0.01)
Adjusted EBITDA(2)(3)
$5.9 $7.7
Adjusted net loss (2)
$(2.0) $(1.1)
Adjusted diluted EPS (2)
$(0.06) $(0.03)
(1) Total revenue excludes other revenue from managed
properties
(reimbursable costs).
(2) Adjusted EBITDA, Adjusted net loss and Adjusted
diluted EPS are non-
GAAP financial measures
and should not be considered as an alternative
to any measures of operating
results under GAAP. See the definition
and further discussion of
non-GAAP financial measures and
reconciliation to net loss
later in this press release.
(3) Includes the company's share of adjusted EBITDA
from investments in
unconsolidated entities
in the amounts of $1.2 million and $1.6
million in the first quarter
of 2009 and 2008, respectively.
(4) The first quarter 2009 results include a $0.8
million charge for
restructuring primarily
related to severance costs as a part of the
company's 2009 cost reduction
program, and $8.9 million of tax expense
relating to the company's
global tax planning strategy. These charges
are excluded from the calculation
of Adjusted EBITDA, Adjusted net
loss and Adjusted diluted
EPS.
(5) The first quarter 2008 results include (i) a
$2.4 million gain on the
sale of the Doral Tesoro
Hotel & Golf Club, and (ii) $1.1 million of
write-offs of intangible
assets related to the sale of certain hotels
in 2008. Each of these
items has been excluded from the calculation
of Adjusted EBITDA, Adjusted
net loss and Adjusted diluted EPS.
"The first quarter was an extremely difficult operating period, a trend
that we anticipate will continue through most of 2009, and possibly into
2010," said Thomas F. Hewitt, chief executive officer. "While our visibility
remains limited, we expect to see the decline in RevPAR begin to moderate
in the second half of the year."
Hotel Management
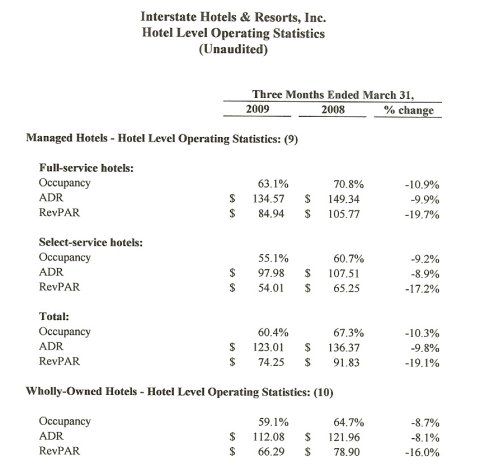
Same-store(6) RevPAR for all managed hotels in the first quarter declined
19.1 percent to $74.25. Average daily rate (ADR) was $123.01, down 9.8
percent, and occupancy fell 10.3 percent to 60.4 percent.
Same-store RevPAR for all full-service managed hotels declined 19.7
percent to $84.94. ADR was off 9.9 percent to $134.57, while occupancy
decreased 10.9 percent to 63.1 percent.
Same-store RevPAR for all select-service managed hotels declined 17.2
percent to $54.01, led by a 9.2 percent decline in occupancy to 55.1 percent
and an 8.9 percent drop in ADR to $97.98.
"The severe condition of the economy continues to present challenges
to the hotel industry," Hewitt said. "However, we remain focused on optimizing
returns for our owners and shareholders. As lodging demand weakened in
the first quarter, we adapted our cost reduction programs to make every
effort to optimize our owners' and shareholders' returns.
"In addition to the cost reduction plans at the property level, we implemented
an extensive corporate cost savings program in January, which resulted
in a decrease of $4.6 million in corporate G&A expense in the first
quarter, a reduction of 29 percent from last year.
"Our portfolio count remained steady in the 2009 first quarter," Hewitt
added. "We continue to focus on growing our managed portfolio and have
several properties scheduled to come on line in the second quarter. We
also have reached out to lenders and loan servicers to offer our expertise
in taking over distressed assets. There has not been much movement in this
area to date, but we expect activity to pick up later this year and next
year, and we are well positioned to respond quickly when opportunities
arise."
.
 .
.
Wholly Owned Hotel Results
EBITDA from the company's seven owned hotels was $4.5 million in the
2009 first quarter as outlined below (in millions):
Owned Hotels
First Quarter
2009 2008
---- ----
Net income (loss)
$(1.3) $0.1
Interest expense, net
$2.9 $3.6
Depreciation and amortization.
$2.9 $3.2
---- ----
EBITDA
$4.5 $6.9
==== ====
"RevPAR for the owned portfolio decreased 16.0 percent, stemming from
an 8.7 percent slide in occupancy and an 8.1 percent decrease in rate,"
Hewitt said. "Our newly renovated Sheraton Columbia (Md.) hotel performed
exceptionally well during the quarter with a 5.2 percent RevPAR increase
over last year.
"Our newly renovated Westin Atlanta Airport hotel performed well compared
to its competitive set and the overall industry with a RevPAR decline of
13.1 percent. Both of these properties have received an overwhelmingly
positive response from customers that are now returning to the hotels following
their comprehensive renovations.
"We saw significant weakness in Arlington, Texas, and Concord, Calif.,
as our hotels in those markets suffered RevPAR declines in excess of our
portfolio average due to local market conditions. While total revenue for
our owned hotels decreased $4.9 million, we were able to control expenses,
leading to an overall expense reduction of $2.4 million."
Balance Sheet
On March 31, 2009, Interstate had:
-- Total unrestricted cash of $13.0 million.
-- Total debt of $244.0 million, consisting of $161.5 million
of senior debt and $82.5 million of non-recourse mortgage debt.
"We have engaged Bank of America to be the lead arranger for the extension
of our credit facility, which has a March 2010 maturity," said Bruce Riggins,
chief financial officer. "We continue to have productive discussions with
our bank group regarding this extension, and our goal is to have this extension
in place by June 30.
"In late March, we received a waiver from our bank group related to
our potential NYSE delisting, pending an appeal process with the Exchange,"
said Riggins. "As part of the waiver agreement, the facility size was permanently
reduced to $173.3 million from $198.0 million and the interest rate was
increased to LIBOR plus 350 basis points from LIBOR plus 275 basis points.
The new facility size provides for $10 million of borrowing capacity, of
which $6 million is available through June 30. We do not expect that we
will need to draw on our revolving facility during the waiver period."
Outlook and Guidance
The company has updated its 2009 guidance to reflect a RevPAR decline
scenario of 17 percent for all managed properties and 14 percent for owned
hotels:
-- Total Adjusted EBITDA of $37 million which includes the following:
-- EBITDA from wholly owned hotels of $19 million;
-- The company's share of EBITDA from unconsolidated joint ventures
of $6 million; and
-- EBITDA from the hotel management business of $12 million.
-- Adjusted net loss of $(1.9) million or $(0.06) per share.
Interstate Hotels & Resorts, Inc.
Consolidated Statements of Operations
(Unaudited, in thousands except per share amounts)
Three Months Ended
March 31,
-------------------
2009 2008
---- ----
Revenue:
Lodging
$19,036 $23,918
Management fees
8,351 9,909
Termination fees (1)
1,246 3,010
Other
1,884 2,099
----- -----
30,517 38,936
Other revenue from managed properties
132,089 151,014
------- -------
Total
revenue
162,606 189,950
Expenses:
Lodging
14,582 17,025
Administrative and general
11,238 15,829
Depreciation and amortization
3,841 4,274
Restructuring costs (2)
831 -
Asset impairments and write-offs
(3)
- 1,112
--- -----
30,492 38,240
Other expenses from managed properties
132,089 151,014
------- -------
Total
operating expenses
162,581 189,254
------- -------
OPERATING INCOME
25 696
Interest income
100 319
Interest expense (4)
(2,907) (3,815)
Equity in (losses) earnings of
unconsolidated entities (5)(6)
(798) 2,361
Gain on sale of investments
13 -
-- -
LOSS BEFORE INCOME TAXES
(3,567) (439)
Income tax (expense) benefit (7)
(8,916) 151
------ ---
NET LOSS
(12,483) (288)
Add: Net loss attributable to noncontrolling
interest
6 2
- -
NET LOSS ATTRIBUTABLE TO INTERSTATE
STOCKHOLDERS
$(12,477) $(286)
======== =====
Basic and diluted loss per share
attributable to Interstate stockholders
$(0.39) $(0.01)
====== ======
Weighted-average basic and diluted shares
outstanding (in thousands)(8)
31,925 31,714
====== ======
Interstate Hotels & Resorts, Inc.
Hotel Level Operating Statistics
(Unaudited)
Three Months Ended March
31,
-------------------------
2009 2008 % change
---- ---- --------
Managed Hotels - Hotel Level Operating Statistics:
(9)
Full-service hotels:
Occupancy
63.1% 70.8% -10.9%
ADR
$134.57 $149.34 -9.9%
RevPAR
$84.94 $105.77 -19.7%
Select-service hotels:
Occupancy
55.1% 60.7% -9.2%
ADR
$97.98 $107.51 -8.9%
RevPAR
$54.01 $65.25 -17.2%
Total:
Occupancy
60.4% 67.3% -10.3%
ADR
$123.01 $136.37 -9.8%
RevPAR
$74.25 $91.83 -19.1%
Wholly-Owned Hotels - Hotel Level Operating
Statistics: (10)
Occupancy
59.1% 64.7% -8.7%
ADR
$112.08 $121.96 -8.1%
RevPAR
$66.29 $78.90 -16.0%
Interstate Hotels & Resorts, Inc.
Reconciliations of Non-GAAP Financial Measures (11)
(Unaudited, in thousands except per share amounts)
Three Months Ended
March 31,
-------------
2009 2008
---- ----
Net loss
$(12,483) $(288)
Adjustments:
Depreciation and amortization
3,841 4,274
Interest expense, net
2,807 3,496
Depreciation and amortization
from unconsolidated
entities
952 701
Interest expense, net from unconsolidated
entities
962 963
Income tax benefit
8,916 (151)
----- ----
EBITDA
4,995 8,995
Restructuring costs (2)
831 -
Asset impairments and write-offs
(3)
- 1,112
Gain on sale of investments
(13) -
Equity interest in the sale
of unconsolidated
entities (5)
- (2,392)
Foreign currency loss from unconsolidated
entities (6)
129 -
------ ------
Adjusted EBITDA
$5,942 $7,715
====== ======
Three Months Ended
March 31,
-------------
2009 2008
---- ----
Net loss
$(12,483) $(288)
Adjustments:
Restructuring costs (2)
831 -
Asset impairments and write-offs
(3)
- 1,112
Gain on sale of investments
(13) -
Deferred financing costs write-off
(4)
119 -
Equity interest in the sale
of unconsolidated
entities (5)
- (2,392)
Foreign currency loss from unconsolidated
entities (6)
129 -
Income tax rate adjustment (7)(12)
9,466 442
----- ---
Adjusted net loss
$(1,951) $(1,126)
======= =======
Adjusted diluted loss per share
$(0.06) $(0.03)
====== ======
Weighted average number of diluted shares
outstanding (in thousands) (8):
31,925 31,714
Interstate Hotels & Resorts, Inc.
Outlook Reconciliation (11)
(Unaudited, in
thousands)
Forecast
----------
Year Ending
December 31, 2009
-------------------
Net loss
$(9,200)
Adjustments:
Depreciation and amortization
17,000
Interest expense, net
14,100
Depreciation and amortization
from
unconsolidated entities
4,300
Interest expense, net from unconsolidated
entities
4,100
Income tax expense
5,700
-----
EBITDA
36,000
Restructuring costs (2)
800
Gain on sale of investments
-
Deferred financing costs write-off
(4)
100
Foreign currency loss from unconsolidated
entities (6)
100
---
Adjusted EBITDA
$37,000
=======
Forecast
----------
Year Ending
December 31, 2009
-------------------
Net Loss
$(9,200)
Adjustments:
Restructuring costs (2)
800
Gain on sale of investments
-
Deferred financing costs write-off
(4)
100
Foreign currency loss from unconsolidated
entities (6)
100
Income tax rate adjustment (7)(12)
6,300
-----
Adjusted Net Loss
$(1,900)
=======
Adjusted diluted loss per share (8)
$(0.06)
======
Interstate Hotels & Resorts, Inc.
Notes to Financial Tables
(Unaudited)
(1) We record termination fees as revenue
when all contingencies related
to the termination
fees have been removed.
(2) In the first quarter of 2009, we recognized
$0.8 million in
restructuring charges,
consisting of severance payments and other
benefits for terminated
employees, associated with our cost-savings
program implemented
in January 2009.
(3) This amount represents losses recorded
for intangible assets
associated with
terminated management contracts and other asset
impairments.
(4) For the first quarter of 2009, interest
expense includes a $0.1
million write-off
of deferred financing costs as a result of the
permanent reduction
in capacity of our credit facility associated
with the waiver
and amendment obtained in March 2009.
(5) In the first quarter of 2008, one of
our joint ventures sold the
Doral Tesoro Hotel
& Golf Club and we recorded a gain of $2.4
million.
(6) One of our international joint ventures
has debt that is denominated
in a currency other
than its functional currency. Each period, the
debt obligation
is translated and the resulting gain or loss is
recognized in our
consolidated statement of operations, although it
is a non-cash event.
(7) In the first quarter of 2009, we created
a foreign subsidiary which
in turn purchased
the rights to license our U.S. parent company's
intellectual property.
This transaction generated U.S. tax expense in
the quarter. This
strategy allows Interstate to shift tax exposure
from foreign subsidiaries
to the U.S. where Interstate can utilize
tax attributes in
the form of net operating loss carryforwards and
tax credits to minimize
our cash taxes paid. The effect of this event
has been excluded
from our adjusted net loss as it is a non-recurring
and non-cash item.
Exclusive of this event, our effective tax rate on
recurring operations
for 2009 is 22.0%.
(8) Our diluted earnings per share assumes
the issuance of common stock
for all potentially
dilutive common stock equivalents outstanding.
Potentially dilutive
shares include unvested restricted stock and
stock options granted
under our comprehensive stock plan and
operating partnership
units held by minority partners. No effect is
shown for any securities
that are anti-dilutive.
(9) We present certain operating statistics
(i.e. occupancy, RevPAR and
ADR) for the periods
included in this report on a same-store hotel
basis. We
define our same-store hotels as those which (i) are
managed or owned
by us for the entirety of the reporting periods
being compared or
have been managed by us for part of the reporting
periods compared
and we have been able to obtain operating statistics
for the period of
time in which we did not manage the hotel, and (ii)
have not sustained
substantial property damage, business
interruption, or
undergone large-scale capital projects during the
current reporting
period being presented. In addition, the operating
results of hotels
for which we no longer managed as of March 31, 2009
are also not included
in same-store hotel results for the periods
presented herein.
Of the 224 properties that we managed as of March
31, 2009, 192 hotels
have been classified as same-store hotels.
RevPAR is defined
as revenue per available room.
(10) Operating statistics for our wholly-owned
hotels includes our entire
portfolio of 7 hotels,
including the Sheraton Columbia and the Westin
Atlanta Airport,
both of which underwent comprehensive renovation
programs throughout
2008.
(11) See discussion of EBITDA, adjusted EBITDA,
adjusted net loss and
adjusted diluted
loss per share, located in the "Non-GAAP Financial
Measures" section,
described earlier in this press release.
(12) This amount represents the effect on income
tax expense for the
adjustments made
to net loss. For the first quarter of 2009 and 2008,
we used the effective
tax rate of 22.0% and 34.5%, respectively. For
2009, the rate excludes
the non-recurring income tax expense
described in footnote
7.
Source: Interstate Hotels & Resorts
CONTACT: Carrie McIntyre, SVP, Treasurer, +1-703-387-3320 |
Earnings Conference Call
Interstate will hold a conference call to discuss its
first-quarter results today, May 6, at 10 a.m. Eastern Time. To hear the
webcast, interested parties may visit the company's Web site at www.ihrco.com
and click on Investor Relations and then First-Quarter Conference Call.
A replay of the conference call will be available until midnight on Wednesday,
May 13, 2009, by dialing (800) 405-2236, reference number 11130289, and
an archived webcast of the conference call will be posted on the company's
Web site through June 6, 2009.
Interstate Hotels & Resorts has ownership interests
in 56 hotels and resorts, including seven wholly owned assets. Together
with these properties, the company and its affiliates manage a total of
224 hospitality properties with more than 45,000 rooms in 37 states, the
District of Columbia, Russia, Mexico, Belgium, Canada and Ireland. Interstate
Hotels & Resorts also has contracts to manage 16 to be built hospitality
properties with approximately 4,000 rooms. For more information about Interstate
Hotels & Resorts, visit the company's Web site: www.ihrco.com.
Non-GAAP Financial Measures
Included in this press release are certain non-GAAP financial
measures, which are measures of our historical or estimated future performance
that are different from measures calculated and presented in accordance
with generally accepted accounting principles in the United States of America
(or GAAP), within the meaning of applicable Securities and Exchange Commission
rules, that we believe are useful to investors. They are as follows: (i)
Earnings before interest, taxes, depreciation and amortization (or "EBITDA")
and (ii) Adjusted EBITDA, Adjusted net loss and Adjusted diluted loss per
share. The following discussion defines these terms and presents the reasons
we believe they are useful measures of our performance.
EBITDA
A significant portion of our non-current assets consists
of intangible assets, related to some of our management contracts, and
long-lived assets, which include the cost of our owned hotels. Intangible
assets, excluding goodwill, are amortized over their expected term. Property
and equipment is depreciated over its useful life. Because amortization
and depreciation are non-cash items, management and many industry investors
believe the presentation of EBITDA is useful. We also exclude depreciation
and amortization and interest expense from our unconsolidated joint ventures.
We believe EBITDA provides useful information to investors regarding our
performance and our capacity to incur and service debt, fund capital expenditures
and expand our business. Management uses EBITDA to evaluate property-level
results and as one measure in determining the value of acquisitions and
dispositions. It is also widely used by management in the annual budget
process. We believe that the rating agencies and a number of lenders use
EBITDA for those purposes and a number of restrictive covenants related
to our indebtedness use measures similar to EBITDA presented herein.
Adjusted EBITDA, Adjusted Net Loss and Adjusted Diluted
EPS
We define Adjusted EBITDA as, EBITDA excluding the effects
of certain recurring and non-recurring charges, transactions and expenses
incurred in connection with events management believes do not provide the
best indication of our ongoing operating performance. These charges include
restructuring and severance expenses, asset impairments and write-offs,
gains and losses on asset dispositions for both consolidated and unconsolidated
investments, and other non-cash charges. We believe that the presentation
of Adjusted EBITDA will provide useful supplemental information to investors
regarding our ongoing operating performance and when combined with the
primary GAAP presentation of net loss, is beneficial to an investor's complete
understanding of our operating performance. We also use Adjusted EBITDA
in determining our incentive compensation for management.
Similarly, we define Adjusted net loss and Adjusted diluted
loss per share ("EPS") as net loss and diluted EPS, without the effects
of those same charges, transactions and expenses described earlier. We
believe that Adjusted EBITDA, Adjusted net loss and Adjusted diluted EPS
are useful performance measures because including these expenses, transactions,
and special charges may either mask or exaggerate trends in our ongoing
operating performance. Furthermore, performance measures that include these
charges may not be indicative of the continuing performance of our underlying
business. Therefore, we present Adjusted EBITDA, Adjusted net loss and
Adjusted diluted EPS because they may help investors to compare our performance
before the effect of various items that do not directly affect our ongoing
operating performance.
Limitations on Use of EBITDA, Adjusted EBITDA, Adjusted
Net Loss and Adjusted Diluted EPS
We calculate EBITDA, Adjusted EBITDA, Adjusted net loss
and Adjusted diluted EPS as we believe they are important measures for
our management's and our investors' understanding of our operations. These
may not be comparable to measures with similar titles as calculated by
other companies. This information should not be considered as an alternative
to net income, operating profit, cash from operations or any other operating
performance measure calculated in accordance with GAAP. Cash receipts and
expenditures from investments, interest expense and other non-cash items
have been and will be incurred and are not reflected in the EBITDA and
Adjusted EBITDA presentations. Adjusted net loss and Adjusted diluted EPS
do not include cash receipts and expenditures related to those same items
and charges discussed above. Management compensates for these limitations
by separately considering these excluded items, all of which should be
considered when evaluating our performance, as well as the usefulness of
our non-GAAP financial measures. Additionally, EBITDA, Adjusted EBITDA,
Adjusted net loss and Adjusted diluted EPS should not be considered a measure
of our liquidity. Adjusted net income and Adjusted diluted EPS should also
not be used as a measure of amounts that accrue directly to our stockholders'
benefit.
This press release contains "forward-looking statements,"
within the meaning of the Private Securities Litigation Reform Act of 1995,
about Interstate Hotels & Resorts, including those statements regarding
future operating results and the timing and composition of revenues, among
others, and statements containing words such as "expects," "believes" or
"will," which indicate that those statements are forward-looking. Except
for historical information, the matters discussed in this press release
are forward-looking statements that are subject to certain risks and uncertainties
that could cause the actual results to differ materially, including the
volatility of the national economy, economic conditions generally and the
hotel and real estate markets specifically, the war in Iraq, international
and geopolitical difficulties or health concerns, governmental actions,
legislative and regulatory changes, availability of debt and equity capital,
interest rates, competition, weather conditions or natural disasters, supply
and demand for lodging facilities in our current and proposed market areas,
and the company's ability to manage integration and growth. Additional
risks are discussed in Interstate Hotels & Resorts' filings with the
Securities and Exchange Commission, including Interstate Hotels & Resorts'
annual report on Form 10-K for the year ended December 31, 2008.
(6) Please see footnote 9 to the financial tables within
this press release for a detailed explanation of "same-store" hotel operating
statistics. |