 |
|
News for the Hospitality Executive |
|
The Accuracy of Hotel Budgets
.
Hoteliers Underestimate 2006 Unit-Level
Costs
| By: Robert Mandelbaum, October 2007
After two consecutive years of double-digit profit gains in 2004 and 2005, U.S. hotel managers expected they would be able to achieve yet another year of extraordinary growth on the bottom-line. When preparing their budgets for 2006, the 400 hotel managers in our sample estimated that a 9.2 percent gain in total revenue would translate into a 21.3 percent surge in profitability. The good news is that management was able to beat the budget and increase sales by 10.2 percent. Unfortunately, despite this top-line achievement, these same hotels missed their bottom-line expectations. In 2006, our sample of hotels enjoyed a strong 16.2 percent growth in profits. In any other year, this would be celebrated as a triumph. However, falling short of profit expectations after exceeding your revenue goals is somewhat disappointing. The culprit was a 7.9 percent surge in operating expenses. This compares to a budgeted expectation of only a 3.7 percent increase in costs. In 2006, we began to observe once again a recent trend in the rise of expenses that are beyond the direct control of management. Examples include employee benefits, insurance, utilities, and property taxes. This rise in uncontrollable costs contributed to the unexpected jump in operating expenses. The preceding results were based on an examination of 400 U.S. hotel financial statements taken from our Trends in the Hotel Industry database. For the purposes of this analysis, profits are defined as income before deductions for capital reserve, rent, interest, income taxes, depreciation and amortization. Less Price, More Accurate Our analysis of budget accuracy was conducted across six chain-scale segments; Economy, Midscale Without F&B, Midscale With F&B, Upscale, Upper-Upscale, and Luxury. Across the board, managers within all chain-scale categories exceeded their budgeted revenue goals for 2006. However, there was a clear demarcation of properties along price point when evaluating the ability of hotels to achieve their bottom-line objectives. Properties operating within the Economy and the two Mid-Market chain-scale segments were all able to surpass their budgeted profit targets for 2006. This was especially true in the Economy segment. The managers at these limited-service facilities actually anticipated a decline in profitability for the year, but ended up achieving a 6.6 percent increase. At the other end of the spectrum, Luxury, Upper-Upscale, and Upscale
hotels all missed their budgeted profit goals in 2006. The majority
of properties in these categories are larger, full-service facilities.
Amenity creep and rising labors costs contributed to the boost in operating
costs at these complex operations.
Percent Difference � By Chain Scale* Actual Compared to Budgeted Performance 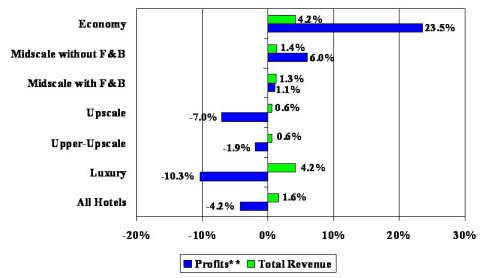
Note: * - Sample of properties that reported budget data. ** - Before deducting capital reserves, rent, interest, income taxes, depreciation, and amortization. Source: PKF Hospitality Research Accuracy In Recovery As industry performance passed through the various phases of the recent business cycle, we have seen dramatic differences in the accuracy of hotel budgets. During the industry recession from 2001 through 2003, hotel managers were missing their top-line revenues by close to ten percent. Meanwhile, bottom-line profits were more 20 to 30 percent off the mark. During the industry recovery from 2004 through 2006, we witnessed a dramatic change in the accuracy of hotel budgets. During this period, hotel managers have consistently been within two percent of their revenue estimates, and four percent of budgeted profitability. It is against the nature of hotel owners and operators to aggressively forecast losses. During the industry downturn of the early 1990s, hotels were accurately budgeting the downward direction of their revenues and profits. However, they consistently under estimated the magnitude of the actual fall off in performance. Compounding the problem was the relative unpredictability of such external events the Iraq War, terrorism, economic recession, and SARS. Conversely, when times are good, those same owners and operators get a little conservative with their forecasts. This helped to contribute to the high degree of accuracy observed in the past three years. What To Budget For 2008 The U.S. lodging industry is entering an extended period at the top of the current industry business cycle. Therefore, PKF Hospitality Research (PKF-HR) is forecasting stable industry performance for the next five years, with average annual changes in unit-level occupancy, average daily room rates (ADR), revenues, and profits commensurate with long-term averages. In 2008, PKF-HR believes the lodging industry will start to feel the
impact of the escalating levels of construction activity that is taking
place. After five consecutive years (2003 � 2007) of gains in occupancy,
PKF-HR is forecasting occupancy to remain flat in 2008. However,
a 4.2 percent increase in ADR is projected to result in an equal 4.2 percent
jump in total hotel revenue.
Percent Difference Actual Compared to Budgeted Performance* 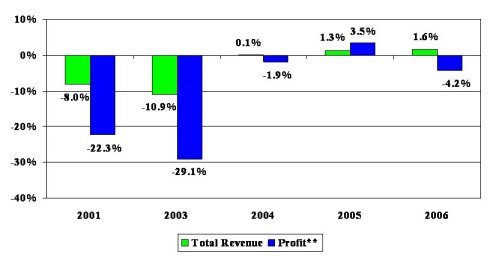
Note: * - Sample of properties that reported budget data. ** - Before deducting capital reserves, rent, interest, income taxes, depreciation, and amortization. Source: PKF Hospitality Research Without an increase in occupied rooms and the associated variable costs, PKF-HR is forecasting hotel operating expenses to be 3.9 percent. This will be the lowest annual change in expenses since 2003. With revenue growing faster than expenses, expect unit-level profits to post a relatively modest gain of 5.1 percent. While this pace of profit growth falls short of recent double-digit gains, it is still projected to be greater than the pace of inflation. Therefore, real profit growth will be achieved in 2008. Once the recession had begun in the early 2000s, it was unfortunately
easy to know which direction hotel revenues and profits were heading.
Then, after bottoming out in 2003, it was inevitable that the only way
hotel performance could go was up. U.S. hotel managers will be challenged
to prepare the direction of their individual budgets in the upcoming period
of relatively stable performance.
Percent Difference Actual Compared to Budgeted Performance* 
Note: * - Sample of properties that reported budget data. ** - Before deducting capital reserves, rent, interest, income taxes, depreciation, and amortization. Source: PKF Hospitality Research .
Robert Mandelbaum is the Director of Research Information Services for PKF Hospitality Research. For more information on tools and services that will help you prepare your hotel�s budget, please visit www.pkfc.com. This article was published in the September 2007 edition of Lodging.
|
| Contact:
Robert Mandelbaum
|
| Also See: | Beating the Budget; U.S. Hoteliers Underestimated 2005 / Robert Mandelbaum / October 2006 |
| The Accuracy of Hotel Budgets / Robert Mandelbaum and David Murff / September 2005 |
|
|