By Vi Thi Dang - HVS Canada
November 2007
Successful hotel performance depends on the ability of asset managers
to foresee capital expenditures. It is thus essential for hotel consultants
and mangers to be informed of current trends in capital expenditures and
the factors that influence capital spending. "CapEx 2007, a study of capital
expenditure in the hotel industry," produced by the International Society
of Hospitality Consultants, provides a good overview of historical and
current capital expenditure trends. This study examines the spending patterns
of different types of hotel products, including fullservice/ luxury, extended-stay,
and select-service hotels, between 2000 and 2005. This article will discuss
the findings of this study and the variables that have affected spending
trends from 2000 to 2005. These factors are business cycles, depreciation,
and ownership structure.
What are capital expenditures?
Capital expenditures are the total money spent on renovation, refurbishing,
and replacing furniture, fixtures and equipment (FF&E) over a specific
period of time and the cost to correct or update obsolescence (e.g. technology
updates, wear and tear, and updates for meeting brand requirements). The
amount spent on capital expenditures is generally calculated as a percentage
of total revenue. Capital expenditures are necessary for maintaining or
improving a hotel's competitive condition; they are thus essential to hotel
operating performance. The study indicates that capital expenditures averaged
5.1% of total revenue in the sample period, ranging from a high of 6.0%
of total revenue for extendedstay properties to a low of 4.7% for full-service/luxury
properties.
Business Cycles
Business cycles have a direct impact on capital spending. The CapEx
2007 study examined hotel operating practices between 2000 and 2005. This
period started "with a boom, became a bust, and then began some recovery."1
The boom was the tail end of a prosperous period for hoteliers that ran
from 1995 to 1999, during which time there were strong increases in capital
spending. Poor economic conditions between 2002 and 2004 caused cash flows
to decline, which in turn caused capital spending to diminish. In particular,
the fallout from the terrorist attacks on September 11, 2001, had a negative
impact on occupancy rates and ADR, which caused capital spending on hotels
to decrease. This slowdown in demand caused operating budgets to tighten.
As a consequence, hotel owners began to negotiate brand requirements, and
hotel chains and construction departments started closely examining proposed
designs to
ensure brand compliance. By the end of 2004 and the beginning of 2005,
owing to a substantial increase in asset transactions and acquisitions
by new owners, capital spending increased and much of the capital improvements
occurred in the form of brand conversions, which added to increasing spending
ratios. From these trends, we can observe that capital expenditures of
hotels are extremely sensitive to business cycles and economic conditions.
Depreciation
Depreciation also affects capital expenditure requirements. As a hotel
ages, the amount spent on capital expenses and on repairs and maintenance
(R&M) increases. The CapEx 2007 study demonstrates that capital expenditures
and R&M costs increase a hotel ages. Generally speaking, minimal capital
expenditures are allocated to newer hotels, and capital expenditures increase
each year thereafter. According to the Capex 2007 study, hotels less than
5 years old had ±0.7% of total revenue allocated to capital expenditures,
±3.1% of total revenue was apportioned to hotels aging between 5
and 15 years, and ±10.5% of total revenue was spent on capital expenses
for hotels older than 15 years of age.
Ownership Structure
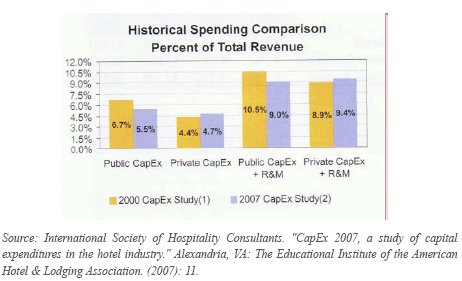
The type of ownership structure also has an influence on capital spending.
Generally speaking, there are two types of ownership: publicly traded hotel
companies (i.e. REITs and Ccorporations) and privately held hotel entities
(e.g. private corporations, equity funds, and pension funds). According
to the CapEx 2007 study, publicly traded hotels have a higher spending
ratio than privately owned hotels. Comparing the CapEx 2007 study to the
CapEx 2000 study, the capital and R&M spending ratios for publicly
owned hotels decreased, whereas an increase occurred for privately owned
hotels.
.
 .
.
There are several factors that can explain this spending pattern. As
discussed earlier, world political events and economic conditions between
2000 and 2005 had an impact on the amount spent on capital expenditures.
Public and private companies employed different approaches for dealing
with the changes in the marketplace, specifically, public companies' CapEx
spending contracted to a greater degree than private companies'. In addition,
the number of hotel transactions increased in 2004 and 2005, and several
new private investors were attracted to the market. Renovations, re-branding,
and market repositioning followed these transactions, resulting in higher
capital spending ratios for hotels that are privately owned. Lastly, the
rise in professional asset management in the private sector, concentrating
on the return requirements of investors and additional profits, also contributed
to the increase in spending ratios for hotels with this ownership structure.
Conclusion
Capital expenditures are extremely sensitive to business cycles and
economic conditions. Regardless of the hotel type, capital expenditure
and repair and maintenance costs increase as a hotel ages. The type of
ownership structure implemented has an effect on the amount spent on capital
expenditures. As previously summarized, average capital expenditures for
all hotel types was 5.1% of total revenue for the study period.
1 International Society of Hospitality Consultants. "CapEx 2007,
a study of capital expenditures in the hotel industry." Alexandria, VA:
The Educational Institute of the American Hotel & Lodging Association.
(2007): 11.
CANADIAN LODGING OUTLOOK
HVS INTERNATIONAL - CANADA
September 2007

.
CANADIAN LODGING OUTLOOK
HVS INTERNATIONAL - CANADA
September 2007 YTD
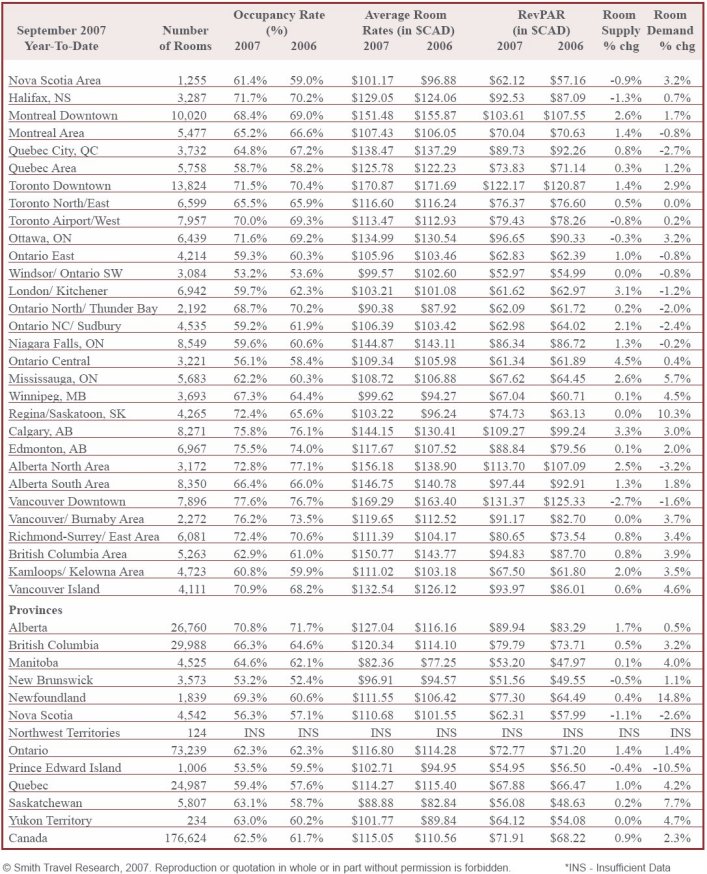
© Smith Travel Research, 2005.
Reproduction or quotation in whole or in part without permission is forbidden.
*INS - Insufficient Data
.
. |