 |
|
|
|
|
|
|
|
. Bottom-Line Comparisons Among Similar Properties Are the �Bottom Line� |
| By Kristin Rohlfs, May 2003
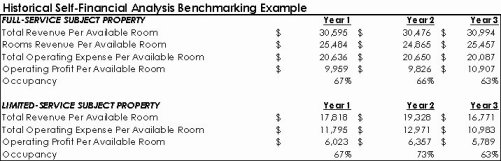
Financial performance benchmarking � the use of comparative data to evaluate hotel operating efficiency � has become increasingly important to hotel operators over the past few years. Wide fluctuations in travel demand and uncertain economic and political conditions have left hoteliers operating in an anomalous environment. As a result, two basic benchmarking techniques have become both more familiar and useful to those in the lodging industry. The first, historical self-financial analysis, shows how a property is performing in relation to its past. The second, group-financial comparison, indicates how well a property is performing compared to a set of similar hotels. The conclusions drawn from these alternative benchmarking techniques may not always coincide and may leave many questions unanswered. Evaluating Alternative Benchmarking Approaches To study the different signals these benchmark techniques give, The Hospitality Research Group performed three-year historical self-financial analyses of a typical full-service hotel and a typical limited-service hotel. BenchmarkerÒ reports, relying on PKF�s Trends in the Hotel Industry financial database, are generated for both subject hotels to perform a group-financial comparison. A BenchmarkerÒ is a bottom-line income statement report produced by HRG that presents financial performance statistics for a hotel against the aggregate average statistics of a comparable set. The comparable sets chosen for each of these subject properties contain six hotels with close similarities to the subject hotel, such as number of rooms, occupancy, ADR, RevPAR, mix of revenues, and property type. The same comparable set was used each year, making this a same-store comparison. Results of the three-year historical self-financial analysis for the full-service subject hotel shows show that total revenue per available room of the subject property grew at a compound rate of 0.7 percent and total operating expenses per available room decreased at a rate of 1.3 percent, resulting in a 4.7 percent increase in operating profit per available room. Total revenue per available room of the limited-service subject property dropped by 3.0 percent during the three years. Total operating expenses per available room fell even faster, at a compound rate of 3.5 percent, resulting in a decrease of 2.0 percent in operating profit per available room. The full-service property seems to be performing relatively well, with revenues increasing and expenses decreasing. The limited-service property seems to be performing poorly, with falling revenues and profits. |
.
| Some Questions to be Answered
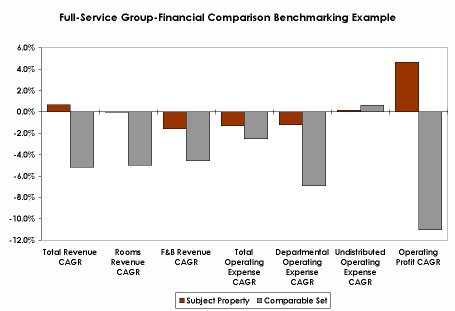
Did the full-service hotel really perform well if typical comparable properties experienced revenue increases of 10 percent over the same three years? Did the limited-service hotel really perform weakly if typical comparable hotels registered even larger decreases in operating profit for the three years? Historical self-financial benchmarking alone cannot answer these questions. Group-financial comparison can answer these questions. This cross-sectional benchmarking technique shows how the subject property has performed in relation to a comparable set. Large variances between the performance of the subject property and the comparable set raise red flags to indicate revenue and expense items that need further investigation. If the performance of the subject property varies significantly from that of the comparable set, then the subject property is most likely either underachieving in terms of revenue or overspending in terms of expense management. Full-Service Hotel Test When weighed against the same six hotels that are similar to the subject, the full-service hotel has obviously outperformed similar properties in revenue growth. Revenues for the comparable set fell over the three years studied while revenues of the subject grew marginally. However, top-line, or revenue, benchmarking can mask how well businesses handle persistent increases in expenses, such as labor, and expense spikes, such as for energy. Expenses for the comparable set fell to a greater extent than expenses of the subject hotel. However, expenses at the subject property fell while total revenues increased � a combination that led the subject hotel to turn a profit while similar properties struggled. This group-financial comparison benchmarking shows us that the full-service subject property has indeed been a strong performer over the years studied � a conclusion that cannot be supported solely by historical self-financial analysis or top-line benchmarking. The management of this hotel should get a round of applause � and a bonus. |
| Comparisons Using Limited-Service
Properties
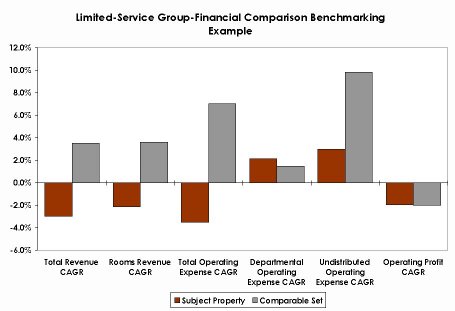
From the historical self-financial analysis, the limited-service property showed declining revenues and profits. To fully understand the context of this performance, the subject is evaluated against the same comparable set of six hotels. The subject property underperformed the similar properties in revenue growth, as revenues for the subject fell at a compound rate over the three years studied while revenues of the comparable set grew at close to 4 percent. Total expenses for the limited-service subject hotel fell over three years, while total expenses of the comparable set rose faster than revenue. As a result, the subject property is still operating on par with comparable properties in light of falling revenue, because it is controlling total costs better than similar hotels. The management of this hotel should get a round of applause � but no bonus. This conclusion could not have been drawn by historical self-financial analysis alone. Despite showing a decline in revenue, the subject property kept pace with the bottom-line of comparable properties. |
| More Than a Buzzword
Benchmarking has moved from its status as a �buzzword� to a practical tool in widespread use by hoteliers. Examining the historical performance of a property is important, but comparing this performance to hotels with similar operating characteristics is paramount to understanding how it is performing in relation to its peers. Benchmarking continues to grow in importance and popularity in the lodging industry, and bottom-line financial benchmarking continues to be a robust measure that can help hoteliers better manage hotels through a prolonged economic downturn, a period of more volatile expenses, and an uncertain environment. Kristin Rohlfs is a Senior Research Associate in the Atlanta office
of The Hospitality Research Group of PKF Consulting (HRG).
|
###
|
Gary Carr Director of Communications PKF Consulting c/o Rising Moon P.O. Box 683 Clayton, CA 94517 (925) 672-8717 [email protected] Mark Woodworth
|