|
Room for Improvement September 2002 |
AFL-CIO Working for America Institute�s Research Director Dr. Howard
Wial and Economic Analyst Jeff Rickert wrote this report with support from
many people in many organizations.
This report presents a profile of the hotel industry from the point of view of those who work in the industry. It describes the industry�s patterns of business organization and competition, jobs, workers, union representation and geographic composition and how these patterns have changed over the last two decades. It also shows how the industry fared in the recent recession and in the aftermath of the Sept. 11 terrorist attacks. Why a report on a single industry? The kinds of labor market outcomes that matter for public policy�such as wages, wage gaps between the rich and the poor, productivity, and overall job quality�come about largely because of competitive decisions that businesses make. Most business competition occurs within industries. The effects of public policies designed to change labor market outcomes can differ by industry, depending on the nature of competition in each industry. To understand how public policies affect jobs and to understand what kinds of policies can improve jobs, it is important to understand industries. There are two broad ways in which businesses may choose to compete. They may take the "high road," competing primarily on the basis of high productivity, high-quality products or services and innovation. Or they may take the "low road," gaining competitive advantage mainly through low costs, including low wages, and paying little or no systematic attention to productivity or quality. The high road makes good jobs possible, while the low road makes them impossible. Too often, though, public debates about the high road and low road remain at a very abstract level. As a result, they are less useful for public policy than they could be. Focusing on particular industries makes it possible to understand just what the high and low roads are in practice. With this understanding, it is possible to formulate public policies that can pave the high road and block the low road. Why the hotel industry? Hotel jobs are generally low-wage jobs, and they have grown faster than all U.S. jobs taken together over the last two decades. Rapid growth of an industry that has many low-wage jobs provides jobs for workers with little formal education or training, including some people leaving welfare, but it may also widen the gap between rich and poor and indicate that low-road competition is an important problem in the industry. Hotels have also been key to many recent central city economic development projects and have often received public economic development subsidies. The use of public funds to subsidize hotel development raises questions about whether those funds are being spent to create low-quality jobs or to encourage economic development based on low-road competitive strategies. The hotel industry should be of special interest to anyone who is concerned about:
In making long-term comparisons over time, we compare the years 1979, 1989, 1995 and 2000, where data permit; where data do not permit these comparisons, we may omit some years, substitute other years, or combine data for multiple years. (We avoid the years 1980-82 and 1990-91, which were recession years. Industry and job patterns during recessions can be very different than those that exist during periods of economic growth. Comparing periods of recession with periods of growth can be misleading if the purpose is to examine long-term trends.) An Overview of the Hotel Industry This section sets the stage for the in-depth data that occupy most of our report. It explains how the hotel industry is organized and describes some of the competitive forces at work in the industry. It also explains how hotel work is organized and describes some of the opportunities and challenges that exist for efforts to improve the quality of hotel jobs. High Road and Low Road: Industrial Organization and Patterns of Competition At the beginning of the twentieth century, the hotel industry was characterized by small, independent operators. With the rise of the automobile, the increase in long-distance travel, and a growing supply of better-educated labor, national chains emerged on the scene. According to one analyst, "Chains . . . allow customers to interact with the same organization when traveling across country, which reduces . . . uncertainty and improves the expectation of good service from patronizing a hotel." Chains grew much faster than the industry as a whole. In 1900, less than one percent of hotels rooms were part of a chain-owned hotel. By 1930, chains owned 15 percent and by 1980, that figure was more than 50 percent. The rise of the hotel chain created new opportunities in the industry by creating administrative structures that required new occupations. The national chain as a dominant form was not possible until a supply of managers and specialized workers could be developed. When that happened, it made possible a division between management and ownership. With the presence of enough professional managers, management companies could be formed. These companies sold their management expertise to hotel owners without having to own hotels. At the same time, real estate investors could enter the market without recruiting staff and managing operations themselves. Local investors could reap returns on their properties by utilizing the expertise and reputation of "brand-name" management companies whose names appeared on the properties. The separation of hotel ownership and management helped fuel the growth of both the industry and the chain. Freed of management responsibility, large numbers of both public and private investors could enter the industry. Management companies could grow and develop expertise without raising funds to buy or build hotel properties. In this environment, chains, which had the administrative apparatus to move quickly to meet the demands of real estate investors interested in developing hotels, grew faster than individually owned and operated hotels. When the real estate boom of the 1980s ended with the recession of 1990-91, the hotel market had become saturated. The early 1990s were a time of reorientation and retrenchment in the industry. Chains lost ground; their market share fell to 45.9 percent of properties by 1990. With the development bust of the early 1990s, competition between hotel management companies increased as fewer new properties were coming online. Power in the owner-management company relationship shifted toward owners. Owners gained more power to negotiate fees, utilize incentive fees, incorporate performance standards into contracts and develop exit clauses for poor performance. Management companies compensated by consolidating, which thinned the field and shifted some bargaining power back to them. The mid-1990s saw a reinvigoration of the chain form, spurred by a rash
of mergers and acquisitions as companies reoriented in order to adjust
to changed market conditions and chains began rapid development of new
properties (figure 1). The chain is now clearly the dominant form in the
industry, in 2000, representing 60 percent of the properties, 68.9 percent
of the rooms, and 69 percent of the market (table 1).
|
|||||||||||||||||||||||||||||||||||
| Despite the industry�s retrenchment in the early 1990s, hotel employment
grew
by nearly 50 percent between 1984 and 2000, adding close to 600,000 jobs.
Expansion of the nation�s transportation infrastructure facilitated tourism
and business travel, helping to fuel much of the industry�s growth. In
the 1990s alone, the amount spent by U.S. residents on travel grew by 29
percent.
The industry�s contribution to the nation�s gross domestic product was a modest 0.9 percent in 1999, up from 0.7 percent in 1987. In states that are major tourist destinations, though, hotels account for a much larger share of the economy. For example, hotels account for 5.4 percent of the gross state product of Hawaii and 15.1 percent of the gross state product of Nevada. The recession that began in March 2001 chilled development in the industry; its continuing effects on the industry will influence short-term growth opportunities for management companies. In the absence of large numbers of new hotels, those companies will need to improve productivity to maintain their profit margins. The United States is unlikely to see renewed growth in the number of hotels or in the number of hotel jobs until the economy recovers strongly or opportunities are created by public investment in downtown economic development. The increase in tourism and business-related travel has made the hotel industry a target for public investment as part of comprehensive economic development plans to revitalize downtown areas. Market Segments Students of the hotel industry often distinguish between different market segments in the industry. In this report, we divide the market into five segments that differ in price and service quality: upper-upscale, upscale, midscale with food and beverage service, midscale without food and beverage service, and economy. Hotels in the upper segments are usually large and often located in central cities or resort areas. They serve business and convention travelers and middle- to high-income tourists, who are more responsive to variations in service quality than to variations in price. Hotels in the lower segments are usually smaller, often (although not always) located in suburbs or along major highways and serve travelers who are more responsive to variations in price than to variations in service quality. High Road and Low Road Competitive Strategies Like firms in other industries, hotels may compete using high road or low road strategies. In the hotel industry, low road competition is characterized by developing marginal hotel property (in most cases this means hotels not in prime locations, or properties in prime locations but utilizing older, less well maintained building stock), little investment in regularly remodeling and upgrading property, offering rooms at a lower price but delivering fewer in-room amenities and offering few on-site attractions. The high road involves competition primarily on the basis of service quality. In the hotel industry, this means developing property in prime locations (including the downtown locations that are currently the targets of much publicly subsidized economic development) and regularly investing in the upkeep and upgrade of the property. High road hotels charge high room rates, but they use amenities and strong customer service, along with on-site attractions (such as restaurants, lounges, conference space, gift shops, and concierge service) to draw customers in and provide incentives for them to spend. High road competition may be more likely in the upper segments of the industry, low road competition in the lower segments. However, managers in all market segments operate within a spectrum between the two extremes of pure high road and pure low road competition. Hotels operating in the limited-service segments must distinguish themselves from other low-cost providers by providing better service, and hoteliers in the upper-upscale and upscale segments must still strive to reduce costs to maximize profits. The greater amount and quality of service in the upper market segments allow hotel companies to demand premium prices and reward investment more directly, making a high road strategy easier to pursue in these segments. To the extent that high road competitive strategies require investment in hotel workers� skills, the major method that owners and managers use to measure productivity may work against the high road. The industry�s primary measure of productivity is revenue per available room (RevPAR), a fact that reveals the importance of capital investment in the industry. RevPAR is a measure of capital productivity, the amount of hotel services produced per "unit" of physical plant in hotels. It does not directly measure labor productivity, the amount of hotel services produced per hour worked by hotel employees. For this reason, it only captures the value of labor indirectly. Since RevPAR does not directly measure labor productivity, it does not directly capture the value of investment in the hotel workforce. Because RevPAR equals the product of the average daily rate (the price of a hotel room) and the hotel room occupancy rate, owners� and managers� focus on RevPAR leads them to view high room prices and high occupancy rates as keys to success. This may distract managers from improving the effectiveness of their internal operations (including their workforce), pointing them instead toward innovation in pricing and marketing. For example, the costs associated with turnover do not appear in RevPAR. To the extent that reduced turnover leads to higher room rates or occupancy rates as a result of higher service quality, RevPAR captures some of the benefits of reduced turnover to hotel employers. However, RevPAR obscures the costs of a highly transient workforce because it does not reflect costs other than availability of capital (the rooms). Reducing turnover would reduce the costs of training, hiring, and recruitment. This would reduce labor costs by reducing the amount of labor needed for training, hiring, and recruitment. Turnover reductions would, therefore, be likely to have a greater impact on labor productivity than on RevPAR. An examination of changes in the composition of revenue in hotels shows
that guest rooms accounted for an increasing share of total revenue during
the 1990s, reinforcing owners� and managers� focus on RevPAR. Between 1992
and 1997, the percentage of revenue generated by room rental went from
59.3 percent to 73 percent (table 2). Sales of meals and alcoholic beverages
for consumption on the premises dropped while the purchase of packaged
items increased slightly. This could be due to the growth of the industry
in the limited-service segments and to outsourcing or closure of some hotel
restaurants during the 1990s. Limited-service establishments do not offer
on-site food and beverage operations or other supplementary revenue-generating
services. It seems probable that the shift in the share of revenue toward
room rental can be attributed to the increase in the relative sizes of
those segments.
Work Organization and Workforce Development Opportunities The growth of the industry has meant the growth of many entry-level jobs. Housekeeping (maids and housemen) is the largest occupation in the industry, making up about 22 percent of total hotel employment. Food service workers, waiters and waitresses, buspersons and bartenders represent 10 percent of hotel employment. These jobs are characterized by relatively low skill requirements for entry. Housekeeping is particularly attractive to new immigrants, likely because the low-level of customer interaction puts less pressure on English proficiency at the point of entry. There is very little occupational advancement within the hotel industry. For each of the largest hotel occupations, figure 2 (page 12) shows the percentage of hotel workers in that occupation in any one year during the late 1990s who moved to other large hotel occupations the following year. (The data are for the years 1995-96, 1996-97, 1997-98, 1998-99 and 1999-2000 combined and include only workers who worked in hotels in both the initial and final years of any of these two-year periods.) Figure 2 shows a link between two hotel occupations only if at least 10 percent of those who worked in one of the occupations moved to the other occupation the following year. The absence of a link in figure 2 may mean either that few workers who stay in the hotel industry leave the occupation in the course of one year or that many leave the occupation but are not concentrated in a small number of "destination" occupations. At least two-thirds of all workers in each of the occupations shown in figure 2 remain in that occupation the following year, except for clerks (65.3 percent remain in the occupation a year later), janitors (42.3 percent remain after a year) and buspersons (39.1 percent remain after a year). Figure 2 shows that the major path of advancement within the hotel industry is from line occupations to supervisory jobs (which cannot be identified precisely using the CPS, but many of which are likely to be included among "other occupations") and then into management. The percentages of workers who move from line occupations to "other occupations" in a one-year period vary greatly among occupations. About 38 percent of janitors who stay in the hotel industry move into "other occupations" within a one-year period, but only about 11 percent of personal service workers, and even smaller percentages of laundry workers, maids, and bartenders do so. Nearly 13 percent of workers in "other occupations" become managers within a one-year period. Clerks are the only line occupation with a major direct path of advancement into management; nearly 13 percent of clerks become managers within a year. Other than advancement into supervisory or management jobs, there is little upward mobility for line workers within the industry. Even among functionally related occupations (such as food and beverage occupations or cleaning occupations), there is little upward mobility. For example, buspersons are not very likely to become bartenders or cooks within a one-year period; nor are laundry workers or maids very likely to become janitors. (The fact that there are so many maids and housemen�22 percent of all hotel workers�and so few janitors�only 2.4 percent of all hotel workers (as figure 5 shows)�makes it especially difficult for maids and housemen to become janitors.) Mobility across functional lines (for example, between cleaning occupations and food and beverage occupations) is also rare. An important feature of hotel jobs is the division between "front-of-the-house" and "back-of-the-house" jobs. A high level of interaction with the customers characterizes front-of- the-house jobs and many of the occupations are tipped jobs (for example, bartender, waiter and waitress, and some personal service occupations, such as valet and doorman). When tips are included, these jobs often pay better than non-tipped jobs with similar or even somewhat higher hourly wages. (The wages shown in figure 2 may not include tips.) Back-of-the-house jobs, such as busperson and laundry worker, require less public interaction and generally command lower wages, even when they require similar levels of skill. For reasons noted later in this section, it is generally difficult for workers to move from back-of-the-house to front-of-the-house jobs. However, a relatively large percentage of buspersons (about 30 percent) moves into table- waiting within a one-year period (and a somewhat smaller percentage of waiters and waitresses become buspersons). The relatively large amount of movement from laundry to housekeeping jobs may also reflect the fact that maids and housemen sometimes receive tips, while laundry workers do not. Among all the major hotel occupations, housekeeping and laundry work seem to have the lowest job quality, as measured by wages and frequency of movement into higher-wage occupations. Hourly wages in both occupations are low, prospects for movement into supervisory or management jobs are very limited and tips, where they exist, are probably smaller than for waiters and waitresses or bartenders. Although housekeeping may lend itself to enhancements through training and process improvement, it appears to be very difficult to create meaningful career ladders for housekeepers within housekeeping departments. Housekeeping departments are hierarchically relatively flat and the occupations above the line-level are getting smaller, as hotel managers try to thin monitoring functions. Inspectresses are being used less, if the occupation is not eliminated. Housekeepers can readily move into only a few supervisory or managerial positions. In the hotels examined in a recent in-depth study, line supervisors constituted 1 to 5 percent of the staff in the housekeeping department, senior managers constituted 1 to 3 percent, and the inspectress position had been eliminated altogether in seven of the eight hotels. In addition, because housekeeping is the largest occupation in the industry, it is likely to be difficult to create career ladders for housekeepers to move easily into other departments. Some hotel departments where career ladders may not now exist could create them. A career path for housekeepers would likely depend on building bridges into one of those departments. The food and beverage area has a number of different occupations at the entry level (e.g., dishwashers, food preparation workers, buspersons), at higher non-supervisory levels (cooks, bartenders, cocktail waitresses, servers, banquet servers), at supervisory levels (sous chefs, banquet captains) and at the management level (executive chefs, restaurant managers). The front desk/hotel service department also has entry-level positions (such as doormen and valets) that could lead to jobs as front desk clerks. This career ladder could then be linked to the existing ladder by which clerks become managers (possibly with an intermediate stint as line supervisors). The creation of career paths between departments and between back-of-the-house and front-of-the-house jobs faces important obstacles. As this report will show, immigrant workers often fill back-of-the-house jobs. Managers often point to a lack of English fluency and people skills as reasons why people do not move up in the industry. A recent study found that managers "pigeonholed" housekeepers and other low-wage workers into their jobs. Managers had no incentive to move workers from back-of-the-house to front-of-the-house jobs particularly not to move housekeepers into other departments. Aside from management preferences, the demand for English fluency and training in interpersonal and problem-solving skills points to a need for workforce development interventions. These interventions are most likely to take hold where the structure of the industry creates opportunities that will support success in the form of career advancement and wage increases. They are most possible in the higher segments of the industry. Larger hotels with higher levels of service and full-service food and beverage operations have a greater potential payoff for investment in worker skills, as well as the revenue to support higher wages and the occupational structure (many entry-level occupations and more tiers in the hierarchy) to support more extensive opportunities for upward mobility. One of the industry�s most widely acknowledged challenges is turnover. Estimates of turnover rate vary widely (from 51.7 percent to 152 percent per year) for line-level employees but in all cases, the turnover rate is high. Estimates of the cost of turnover also vary widely, from $3,000 per employee to $13,000 per employee. In an American Hotel Foundation (AHF) survey of hotel employees, respondents identified the five top internal causes of turnover as pay, communication problems, lack of advancement opportunity, lack of recognition for a job well done and poor conflict management. Employees identified the top five external causes as better pay elsewhere, better wages in other industries, low unemployment, a strong regional economy and low quality of employees overall. The reasons cited for turnover (low wages, lack of career opportunity, conflict, etc.) are all problems that can be the focus of workforce development initiatives. It seems likely that workforce development initiatives could benefit workers and employers in a way that raises productivity, which would create a foundation for improved wages in the industry. Higher wages, in turn, would reduce labor turnover, further increasing productivity. Respondents to the AHF survey identified five remedies for turnover: provide recognition for a job well done, select employees carefully, correct communication problems, improve opportunities for employees to share their opinions about how work is done and improve training. Workforce development programs exist that focus on improving recruitment, providing pre-hire and on-the-job training and promoting conflict resolution on the job. These could be expanded and reproduced elsewhere. In the era of work-first welfare reform, the industry has attracted the interest of workforce development practitioners because (1) it provides many entry-level jobs that offer a starting place for workers with lower skills, new immigrants, and workers re-entering the workforce and (2) in many places it provides employee benefits. In order to be a good workforce development target, however, the industry will have to improve the quality of jobs throughout the industry at the same time that it builds bridges from entry-level jobs to higher-skilled, better-paying occupations. The hotel industry allows a starting point where workers could potentially obtain additional training.Workers could take adult basic education and English for speakers of other languages without having to quit their jobs, but the industry rarely provides these opportunities to workers. The industry�s scarcity of family-sustaining jobs (documented later in this report), high rates of turnover and scarcity of actual (as opposed to potential) career ladders are problems that must be solved if hotel jobs are to become a route to self-sufficiency for people leaving welfare. This section paints a statistical picture of hotel jobs�their employment levels, wages, benefits, hours, occupational composition, health and safety record and other job characteristics�and shows how those jobs have changed over the last two decades. Job quality in the hotel industry is high in some respects and low in others. On the positive side: Job growth and wage growth in the industry have been relatively strong; few hotel workers work 45 or more hours per week; occupational illness and fatality rates are low and hotel workers have average rates of occupational and industry turnover. On the negative side: Hotel wages are low; employee benefits have been falling; many jobs are part-time and many part-time workers would prefer full-time work; job turnover is high; occupational injury rates are high and workers in some major hotel occupations face wage cuts when their work is outsourced to restaurants or building service companies. The wage gap between high- and low-wage hotel workers is lower than for the United States as a whole but higher than in some other low-wage industries and, as in the nation as a whole, it has grown over the last two decades. Hotel Employment Grew Rapidly Over Last Two Decades The U.S. hotel industry employs about 1.8 million people. This amounts to 1.4 percent of all workers in the United States, a figure that has remained relatively stable over the last decade and a half. Hotel employment grew much faster than U.S. total employment over the entire period 1984-2000, reflecting the major expansion of hotels in the 1980s. From 1984 to 2000, hotel employment increased by nearly 600,000. In the early 1990s, a time of industry retrenchment, hotel employment grew more slowly than U.S. total employment, but still added about 50,000 jobs. In the late 1990s, hotel employment grew slightly faster than U.S.total employment. (See table 3.) |
|||||||||||||||||||||||||||||||||
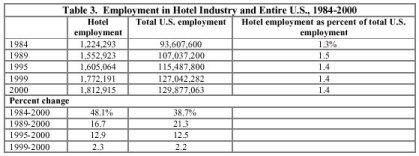
Source: WAI analysis of BLS ES-202 data. 1984 data used because 1979 data are not available for this data series. . |
| Hotels Are More Than Twice as Large as Average U.S. Business Establishment
The average hotel employs more than twice as many people as the average U.S. business establishment (figure 3). In 2000, the average hotel employed 36 people, while the average U.S. establishment employed 16 people. Hotel size (that is, the average number of employees per establishment) grew in the 1980s (along with industry expansion) to a peak of 38 people per establishment. It then fell in the early 1990s to 35 (with industry retrenchment) and has remained fairly stable since 1995. In contrast, overall U.S. establishment size fell throughout the 1980s and early 1990s, from 18 to 16. Since 1995, average U.S. establishment size has remained steady at 16. |
Source: WAI analysis of BLS ES-202 data.
| Hotel Workers Earn 72 Cents for Every Dollar Earned by U.S. Workers
Overall
Hotels are a low-wage industry. In 2000, the median wage of hotel workers was $8.62 per hour (table 4). This median wage is for all hotel and motel employees in the United States regardless of location or occupation. The median is the wage earned by someone who falls right in the middle of all wage-earners. Half of all hotel workers earn more than the median wage and half earn less. The median wage is a better measure than the average wage of what a typical worker earns, since the median wage, unlike the average wage, is not influenced by the wages of a few very highly paid workers. Our analysis of CPS ORG data shows that, in 2000, only 28.6 percent of all U.S. workers earned less per hour than the median hotel worker. Hotel workers� median wage was about 72 percent of that of all U.S. workers in 2000, up from 66 percent in 1979. These wages may not include tips. Hotel workers� wages fell during the 1980s, while all U.S. workers�
wages rose slightly during that decade. During the early 1990s, though,
hotel workers received raises while all U.S. workers took pay cuts. The
late 1990s were a period of progress for hotel workers� wages, as they
were for the wages of U.S. workers and low-wage U.S. workers generally.
Both hotel workers and all U.S. workers received raises in the late 1990s,
but hotel workers received larger percentage raises. Because of their faster
growth throughout the 1990s, hotel wages grew faster than all U.S. workers�
wages during the last two decades and the last decade as a whole. Some
of the growth of hotel workers� wages may be due to the increase in the
percentage of managers and the decrease in the percentage of waiters and
waitresses (whose hourly wages, excluding tips, are low) in the hotel workforce.
Still, hotel workers� median hourly wage was $3.41 below the median for
all U.S. workers in 2000.
Gap Between High and Low Earners in Hotel Industry Is Growing Wage inequality has been growing in the hotel industry over the last
two decades, as it has been in the national economy. The gap between the
wages of high-wage and low-wage earners in the hotel industry was higher
in 2000 than in any of the previous years for which we report data (table
5). (We define low-wage hotel workers as those who earn less than 90 percent
of all hotel workers and more than 10 percent. High-wage hotel workers
are those who earn more than 90 percent of all hotel workers and less than
10 percent. Our findings about wage inequality in the hotel industry pertain
to all hotel and motel employees in the United States, regardless of occupation
or location; they do not pertain to inequality within individual companies
or establishments.)
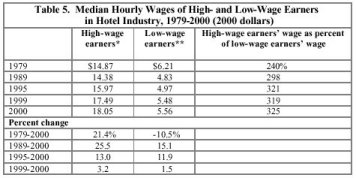
*Low-wage earners are defined as those who earn more than 10 percent of all hotel workers and less than 90 percent. **High-wage earners are defined as those who earn more than 90 percent of all hotel workers and less than 10 percent. Source: WAI analysis of CPS ORG data. Low-wage hotel workers have not yet made up their losses since 1979, while their high-wage counterparts now earn $2.62 more per hour than in 1979. The high-wage/low-wage gap in hotels grew from 1979 through 1995. During the 1980s, this growth was due to the fact that low-wage earners� wages fell faster than those of high-wage earners. During the early 1990s, it was due to that fact that high-wage earners� wage growth outpaced that of low-wage earners. The gap fell from 1995-99, reflecting faster wage growth among low-wage earners, a phenomenon that also occurred in the U.S. economy as a whole. It then rose from 1999-2000 because of faster wage growth at the top. Hotels have a larger high-wage to low-wage gap than several other low-wage industries with comparable median wage levels. Table 6 compares the wages of high-, median and low-wage earners in the hotel industry with those of workers in eight other industries whose median wages are within one dollar per hour of the hotel median wage ($8.62 per hour) and with those of U.S. workers as a whole. Among the eight comparison industries, the gap between high- and low-wage earners was higher in hotels than in any other industry except apparel manufacturing. (The comparison includes all employees in each industry, regardless of occupation or location.) However, the wage gap between high- and low-wage workers is smaller
in the hotel industry than in the U.S. economy as a whole. In comparing
the wages of hotel workers with those of their counterparts in the U.S.
economy as a whole, it is important to keep in mind that hotel wages are
lower than those of U.S. workers in general. In 2000, high-wage hotel workers
(those who earned more than 90 percent of all hotel workers) earned more
than only 73.9 percent of all U.S. workers. Low-wage hotel workers (those
who earned more than 10 percent of all hotel workers) earned more than
only 5.7 percent of all U.S. workers. The median hotel worker earned more
than only 28.6 percent of all U.S. workers.
**High-wage earners in an industry are defined as those who earn more than 90 percent of all workers in the industry and less than 10 percent. High-wage earners in the entire United States are defined as those who earn more than 90 percent of all U.S. workers and less than 10 percent. Source: WAI analysis of CPS ORG data. Poverty Wages More Common in Hotel Industry Than in United States Overall One way to measure the adequacy of wages is to determine whether a person who works full-time throughout the year (2,080 hours per year) can earn more than the federal poverty level for a two-adult, two-child family. In 2000, a full-time, full-year worker had to earn at least $8.40 per hour to exceed that poverty level, which was $17,463 per year. Not all workers who earned less than $8.40 per hour lived in poverty, since some could have exceeded the poverty level by relying on the earnings of other family members, working more than one job or working longer than regular full-time hours. Therefore, the share of workers who earned a poverty wage is greater than the share who actually lived in poverty. Nevertheless, the poverty wage share is a useful way of measuring whether wages are sufficient to support a minimal standard of living. The share of hotel workers earning a poverty wage (less than $8.40 per hour in 2000 dollars) is greater than the share for all U.S. workers. However, the gap has narrowed because hotel workers� poverty wage share fell faster than that of all U.S. workers (figure 4). As noted above, these wage data may not include tips. They represent the wages of all hotel and motel employees in the United States, regardless of location or occupation. In 1979, 57 percent of all hotel workers earned poverty wages, compared to 27 percent of all U.S. workers. After rising in the 1980s and falling in the 1990s, the poverty wage share for hotel workers was 47 percent in 2000. For all U.S. workers, the share rose in the 1980s and early 1990s and fell only in the late 1990s, a period of progress for low-wage workers generally. For all U.S. workers, the share was the same in 2000 as in 1979. |
||||||||||||||||||||||||||||||||||||||||||||||||||||||||||||||||||||||||||||||||||||||||||||||||||||||
| Managers Make Up a Growing Proportion of Hotel Employment
Our analysis of CPS ORG data shows that managers� share of hotel employment rose from 16.0 percent in the late 1980s (1985-89) to 18.3 percent in the late 1990s (1996-2000), while waiters� and waitresses� share of hotel employment declined dramatically (7.4 percent to 4.5 percent). The latter change could be due to the outsourcing or closing of some hotel restaurants. Otherwise, occupational composition has not changed much since the late 1980s. The largest hotel industry occupations in the late 1990s were maids and housemen (more than one in five hotel workers), managers (18 percent), clerks (9 percent) and cooks and personal service workers (about 5 percent each) (figure 5). |
| Employee Benefits Have Fallen Since 1995
Hotel workers� wages grew faster than their employee benefits during
the last two decades and during the last decade (table 8). (These data
cover all hotel and motel employees in the United States, including all
locations and occupations.) Since 1995, benefits actually fell even as
wages rose. As a percentage of total compensation, hotel workers� benefits
rose through the mid-1990s and fell after that; in 2000, the benefit share
of compensation was slightly above its 1979 level. All U.S. domestic industries
experienced the same trends in the benefit share of compensation as hotels.
These findings are consistent with the growth rate of health insurance
costs diminishing in the late 1990s due to managed care, and with the growth
rate of pension costs shrinking due to a shift from defined benefit plans
to defined contribution plans, which may be cheaper for employers. Benefits
are a lower share of total compensation for hotel workers (12.6 percent
benefit share in 2000) than for all workers in U.S. domestic industries
(15.3 percent benefit share.)
**Benefits include health, pension, and other non-wage benefits, plus payroll taxes for Social Security, Medicare, unemployment insurance and other government social insurance programs. ***Annual compound rate of growth. Source: WAI analysis of Bureau of Economic Analysis� National Income and Product Accounts data. One in Five Hotel Workers Works Part-Time, One in Five Part-Time Hotel Workers Would Prefer Full-Time Work Compared to U.S. workers as a whole, hotel workers (including all hotel occupations and geographic locations) are more likely to work part-time and less likely to work long hours. About one in five hotel workers works part-time (defined as less than 35 hours per week on all jobs). Hotel workers are slightly more likely to work part-time than U.S. workers as a whole (table 9). The share of hotel workers working part-time was markedly lower in 2000 than in 1979 (when it was nearly 25 percent). In contrast, U.S. workers as a whole were slightly more likely to work part-time in 2000 than in 1979. If part-time work is defined more broadly to include workers who have more than one job and work 35 or more hours per week but do not usually work full-time, the share of hotel workers working part-time increases slightly to 23.1 percent in 2000, while the share of all U.S. workers working part-time rises to 21.0 percent. Using this broader definition, the trends in part-time employment since 1995 for both hotel workers and all U.S. workers are the same as those we found using the definition above. (Due to changes in the CPS in 1994, this broader definition cannot be applied for years prior to 1994.) Part-time hotel workers are almost twice as likely as part-timers in the United States as a whole to be working part-time involuntarily. (That is, they would rather be working full-time but were working part-time for economic reasons such as inability to find a full-time job.) Our analysis of CPS ORG data shows that, in 2000, 20.9 percent of part-time hotel workers were involuntary part-timers. Only 10.8 percent of all U.S. part-time workers were involuntary part-timers. About 12.9 percent of hotel workers work long hours, which we define
as 45 or more hours per week on all jobs. (We set the cutoff at 45 hours
in order not to include people who work a few overtime hours.) This share
is much smaller than the 19.1 percent share of all U.S. workers who work
long hours. While all U.S. workers were more likely to work long hours
in 2000 than in 1979, the share of hotel workers working long hours was
the same in 2000 as in 1979.
**45 or more hours per week on all jobs. Source: WAI analysis of CPS ORG data on usual weekly work hours. Hotel Workers Have High Job Turnover, but Stay in the Hotel Industry A popular image of low-wage service sector workers is that they frequently change employers, industries and occupations. This image is only partially true for hotel workers. One recent industry source estimated that front-line lodging workers have a 51.7 percent annual turnover rate, while another estimated a 152 percent annual turnover rate. An earlier study found an average of 60 percent annual turnover among hotel accounting, engineering, food and beverage, housekeeping and front office workers combined, with especially high turnover among housekeeping, food and beverage and front office workers. But although hotel workers move from employer to employer often, they are no more likely to change industries or occupations than U.S. workers as a whole. About 59 percent of those employed in the hotel industry in 1999 worked in the same industry a year later; 45.4 percent worked in the same occupation a year later and 40.7 percent worked in both the same industry and the same occupation a year later. These figures are not very different from those for U.S. workers as a whole (figure 7). In fact, hotel workers were somewhat more likely than U.S. workers as a whole to remain in both the same industry and the same occupation. Hotel employers, unions and workforce development practitioners should recognize the stability of hotel workers� employment in their industry and occupations even as they also recognize the instability of those workers� connections to individual employers. |
||||||||||||||||||||||||||||||||||||||||||||||||||||||||||||||||||||||||||||||||||||||||||||||||||||||||||||||||||
| Hotel Workers Have High Job-Related Injury Rate, Low Illness
and Death Rates
Hotels have high occupational injury rates but low occupational illness and fatality rates. Data collected by the Bureau of Labor Statistics show that, since 1992, hotel workers averaged about 115,000 occupational injuries per year, or 8.9 injuries per 100 full-time workers (table 10). Hotel workers� injury rate is above the overall U.S. private sector average of 7.0 injuries per 100 full-time workers since 1992. Injury rates for both hotel workers and all U.S. private sector workers declined since 1992. Hotel workers averaged about 3,300 occupational illnesses per year since 1992. Hotel workers� illness rate (an average of 0.25 illnesses per 100 full-time workers since 1992) is about half that of all U.S. private sector workers. It is now below its 1995 peak, but unlike that of the U.S. private sector as a whole, it did not fall continuously during the 1990s. Hotel workers averaged about 32 on-the-job fatalities per year since 1992, or 0.002 fatalities per 100 full-time workers. Their fatal injury rate is lower than that for U.S. private sector as a whole (average of 0.007 per 100 full-time workers since 1992). As in the U.S. private sector as a whole, hotel workers� fatal injury rate fell during the 1990s. 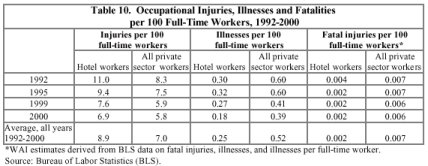
This section looks at the demographic characteristics of the hotel workforce and the wages that hotel workers in each demographic group earn. Compared with all U.S. workers, hotel workers are younger, more likely to be female and foreign-born, less likely to be white and likely to have less formal education. Hotel workers in almost every demographic category earn less than U.S. workers as a whole. Hotel wage inequality has grown along most demographic dimensions during the last two decades, with the notable exception of the male-female wage gap, which has narrowed. Most Hotel Workers Are Women The typical hotel worker (from among all U.S. hotel workers regardless of occupation or location) is a native-born, middle-aged white woman with a high school diploma or less. Most hotel workers (nearly 59 percent) are women, and this percentage has not changed much over the last two decades. In contrast, a slight majority of all U.S. workers are men. Table 11 provides more detail on the demographic characteristics of hotel workers. Most hotel workers are white, but whites are a smaller share of the hotel workforce (54.4 percent white) than of all U.S. workers (72.5 percent white). Hotel workers are more likely to be black, more likely to be Hispanic and more likely to be of other races (including Asian and Native American) than U.S. workers as a whole. During the last two decades, the shares of hotel workers that are white and black dropped, while the shares that are Hispanic and of other races increased. Hotel workers are younger than U.S. workers in general. Nearly 22 percent of hotel workers are under age 25, while just over 27 percent are 45 or older. Among all U.S. workers, just under 17 percent are under age 25 and nearly a third are 45 or older. The share of hotel workers under 35 was lower in 2000 than in 1979, as was the share that is 55 or older. In part, this may reflect the presence of the large baby-boom generation in the industry�s workforce. Hotel workers have less formal education than U.S. workers overall. About 58 percent of hotel workers have no more formal schooling than a high school diploma, compared to about 44 percent of all U.S. workers. Nearly a quarter of hotel workers lack a high school diploma, compared to about an eighth of all U.S. workers. Only about 16 percent of hotel workers, but nearly 27 percent of all American workers, have at least a college degree. However, the level of formal schooling among hotel workers rose substantially since 1979. The share of hotel workers without a high school diploma dropped by more than 10 percentage points and the share with college degrees or more rose by 7 percentage points between 1979 and 2000. Although most hotel workers are U.S. natives, hotel workers are more
likely to be foreign-born (defined as all who are either non-citizens or
naturalized citizens) than all U.S. workers. More than a quarter of hotel
workers are foreign-born, while only about an eighth of all U.S. workers
are. The foreign-born share of the hotel workforce grew substantially from
about 23 percent in 1995 to about 28 percent in 2000.
**Foreign-born are defined as all who are either non-citizens or naturalized citizens. Foreign-born do not include U.S. natives born abroad. Note: NA=not available. The CPS did not collect information on immigration or citizenship until 1994. Source: WAI analysis of CPS ORG data. Hispanic Share of Hotel Occupations Increased in 1990s Table 12 shows the demographic characteristics of workers in the major
occupational categories in the hotel industry for the late 1980s and late
1990s. The percentages of cooks, janitors, laundry workers, maids and housemen,
and waiters and waitresses who were Hispanic grew substantially from the
late 1980s to the late 1990s. For example, in the late 1980s, one in ten
waiters and waitresses was Hispanic, but by the late 1990s, over one in
four was Hispanic. During the same period, the percentages of janitors,
laundry workers, maids and housemen and waiters and waitresses who were
white declined by large percentages. Among laundry workers, maids and housemen
and waiters and waitresses, the increase in the Hispanic share of employment
was about equal to the decline in the white share. Among janitors, the
increase in the Hispanic share was much less than the decline in the white
share. Of the occupations with a large increase in the Hispanic share,
only cooks had a much greater increase in the Hispanic share than decline
in the white share. The percentage of workers who were African American
rose substantially among clerks and more modestly among managers, declined
by 3.6 percentage points among cooks, and fell by less than three percentage
points in other occupations for which data were available.
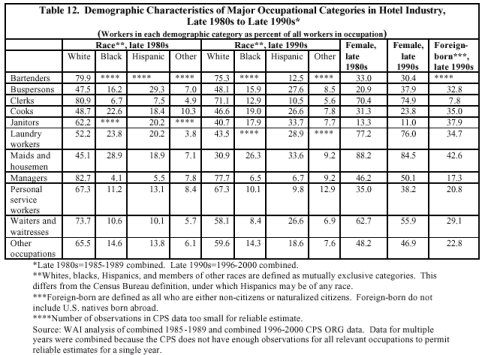
The share of female buspersons increased by 17 percentage points from the late 1980s to the late 1990s, but the share of female wait-staff declined by nearly 7 percentage points. The shares of foreign-born workers in the hotel industry varied widely by occupation. Relatively few hotel clerks (7.8 percent) and managers (17.3 percent) were foreign-born in the late 1990s. However, over one-third of maids, cooks, janitors, and laundry workers were foreign-born in the late 1990s. (Because data on foreign-born workers are available only since 1994, we are unable to examine changes from the late 1980s to the late 1990s in the percentages of hotel workers who were foreign-born.) Nearly a Third of Foreign-Born Hotel Workers Are from Mexico Almost a third of foreign-born hotel workers were born in Mexico. Nearly
60 percent of foreign-born hotel workers were born in just six countries:
Mexico, the Philippines, El Salvador, Haiti, India, Dominican Republic
and Cuba (figure 8). In contrast, only about 46 percent of all foreign-born
workers in the U.S. were born in those countries. In general, foreign-born
hotel workers� regions of birth were similar to those of all U.S. foreign-born
workers, except that hotel workers were somewhat more likely to be from
Mexico, less likely to be from Asia and much less likely to be from Europe
(table 13). These data represent all foreign-born U.S. hotel workers regardless
of location or occupation. Foreign-born hotel workers in particular occupations
or particular regions may have different origins than foreign-born U.S.
hotel workers as a whole.
*Foreign-born are defined as all who are either non-citizens
or naturalized citizens. Foreign-born do not include U.S. natives born
abroad.
|
||||||||||||||||||||||||||||||||||||||||||||||||||||||||||||||||||||||||||||||||||||||||||||||||||||||||||||||||||||||||||||||||||||||||||||||||||||||||||||||||||||||||||||||||||||||||||||||||||||
| Hotel Wage Gaps by Age, Race and Education Grew Over Past Two Decades;
Male-Female Gap Narrowed Hotel wages increase more slowly with age than wages of U.S. workers
overall, and they peak at an earlier age (age 35-44 as compared with 45-54
for all U.S. workers). Age-related wage gaps are smaller (in both absolute
and relative terms) for hotel workers than for U.S. workers overall (table
14). Older hotel workers (age 55+) suffer less of a wage drop-off from
their peak earning years than U.S. workers overall (8.4 percent wage drop-off
for hotel workers in 2000, 17 percent for all U.S. workers). During the
past two decades, wages generally rose fastest for the 45-54 age range
and slowest for the 16-24 age range, increasing the percentage gap between
young and middle-aged workers� wages. The exception was 1999-2000, when
workers ages 25 to 34 had the fastest wage growth. All young workers (those
under age 25) lost ground since 1979, and workers aged 21-24 lost ground
from 1999-2000.
The male-female percentage wage gap is smaller in hotels than in the
U.S. overall. In 2000, the median hourly wage for male hotel workers was
$9.73, compared to $8.00 for women; women in the hotel industry earned
about 82 percent of what men earned. In the United States as a whole, women
earned about 77 percent of what men earned. Women hotel workers received
faster wage increases in hotels since 1979 and since 1995, while men gained
faster wage increases since 1989 and since 1999 (table 15). As a result,
the male-female wage gap narrowed over the past two decades as a whole,
although it fluctuated during the various parts of that period.
The gap between the wages of college-educated and non-college-educated
hotel workers grew during the last two decades, as it did in the United
States as a whole. During most of the last two decades in the hotel industry,
college graduates received the largest percentage raises (table 16). (In
1999-2000, though, hotel workers with less than a high school diploma received
the largest percentage raises.) Those with some college lost ground since
1979, with a median hourly wage decline of 8 cents. In 1979, hotel workers
with a college degree earned about 45 percent more than workers with only
a high school diploma. By 2000, that gap had grown to 62 percent. However,
the college-high school wage gap was still smaller in the hotel industry
in 2000 than in the United States as a whole; in the United States as a
whole, college graduates earned 87 percent more than those with only a
high school diploma.
Blacks and Hispanics have less of a wage penalty (relative to whites)
in the hotel industry than in the United States as a whole. In 2000, blacks
in the hotel industry earned 87 percent of what whites earned, but in the
entire United States, blacks earned only 79 percent of what whites earned.
Hispanics in the hotel industry earned 87 percent of what whites earned,
but in the entire United States, they earned only 69 percent of what whites
earned. Members of other races actually earned more than whites in the
hotel industry, but not in the United States as a whole. In 2000, blacks
and Hispanics earned about the same wages in the hotel industry, while
Hispanics earned less than blacks in the United States overall. Hotel wages
rose for all races during most of the last two decades. Whites received
the biggest percentage raises since 1979 and since 1989, Hispanics since
1995 and since 1999. Other races received the smallest raises in most periods
and took pay cuts from 1999-2000. As a result, the white/black and white/Hispanic
wage gaps in the hotel industry widened over the last decade and the last
two decades as a whole, but narrowed slightly for Hispanics since 1995
(table 17).
Source: WAI analysis of CPS ORG data. Foreign-born workers earn less than natives in the hotel industry and
among all U.S. workers, but the percentage wage gap between native and
foreign-born workers is smaller in hotels than for all U.S. workers (table
18). Foreign-born hotel workers� wages grew faster than those of their
native counterparts from 1995 to 2000, narrowing the wage the gap between
the two groups, but the opposite occurred from 1999-2000. Foreign-born
workers in the hotel industry earn more than blacks or Hispanics in the
industry.
Source: WAI analysis of CPS ORG data. Our finding that demographically based wage differentials are smaller in the hotel industry than in the United States as a whole does not necessarily mean that the hotel industry has less wage discrimination than other industries. Parts of the national wage differences between demographic groups are due to the fact that women, racial minorities and immigrants work disproportionately in low-wage industries. Within a low-wage industry such as hotels, it might be expected that women�s wages would be more similar to men�s, non-whites� to whites� and immigrants� to natives�, than in the U.S. economy as a whole. As in most of our previous analyses, our wage data represent the wages of all hotel and motel employees in the United States, regardless of occupation or location. Some of the wage differences between hotel workers in different demographic groups could be due to differences in job category or location. (For example, if foreign-born hotel workers are disproportionately employed in low-wage occupations, then part of the difference between the wages of native and foreign-born hotel workers may be a result of the difference in occupation.) The section compares union and nonunion hotel workers. (Except where otherwise noted, we define union workers as those who are represented by unions, regardless of whether or not they are union members. Nonunion employees, such as managers, are counted as nonunion workers even if they work in a hotel where other workers are represented by a union.) Unions represent a slightly higher percentage of hotel workers than of all private sector workers, but a lower percentage than of all U.S. workers. Union hotel workers earn more than their nonunion counterparts and are much less likely to earn poverty wages. Union hotel workers are more likely to be men, foreign-born and racial minorities than are their nonunion counterparts. Unions Represent 11.7 Percent of Hotel Workers In 2000, labor unions represented 11.7 percent of all hotel workers
(table 19). (This includes both union members and non-members who were
covered under collective bargaining agreements.) This percentage was higher
than the 9.8 percent of U.S. private sector workers who were represented
by unions, but lower than the 14.9 percent of all U.S. workers who were
represented by unions. About 11.3 percent of hotel workers were union members.
The percentage of hotel workers represented by unions fell slightly during
the entire time period we examined. The percentage that were members of
unions fell until 1999, but then rose in 2000 closer to its 1995 level.
Union Hotel Workers Tend to Earn More Than Nonunion Workers Table 20 shows that hotel workers represented by unions earned 17.6
percent more per hour than nonunion hotel workers. (This figure is not
adjusted for demographic, economic, or locational characteristics that
could be responsible for part of the union-nonunion wage differential.
When those characteristics are taken into account, union hotel workers
earn 9.9 percent more per hour than their nonunion counterparts.) Nonunion
wages grew faster than union wages over the entire period since 1989, narrowing
the union-nonunion wage gap. In 1989, union hotel workers earned $2.43
per hour more than nonunion workers; by 2000, this difference was $1.50.
Union
workers lost ground from 1999-2000, experiencing a wage decline of 34 cents
per hour. As noted above, our wage data may not include tips. They represent
the wages of all hotel and motel employees in the United States, regardless
of location or occupation.
Poverty Wages Less Common for Union Than for Nonunion Workers Poverty wages are much less common among union hotel workers than among their nonunion counterparts, although the gap has narrowed due to improvement in the nonunion sector. In 2000, 50 percent of nonunion hotel workers earned poverty wages, compared to 30 percent of hotel workers represented by unions (figure 9). As noted in our discussion of poverty wages for all hotel workers, this does not mean that 30 percent of union hotel workers (or 50 percent of nonunion hotel workers) lived in poverty, since some could have exceeded the poverty level by relying on the earnings of other family members, working more than one job or working longer than regular full-time hours. They represent the wages of all hotel and motel employees in the United States, from all occupations and locations. |
||||||||||||||||||||||||||||||||||||||||||||||||||||||||||||||||||||||||||||||||||||||||||||||||||||||||||||||||||||||||||||||||||||||||||||||||||||||||||||||||||||||||||||||||||||||||||||||||||||||||||||||||||||||||||||||||||||||||||||||||||||||||||||||||||||||||||||||||||||||||||||||||||||||||||||||||||||||||||||||||||||||||||||||||||||||||||||||||||||||||||||||||||||||||||||||||||||||||||||||||||
|
All Hotel Workers Earn More in Regions With High Rates of Hotel Union Representation Previous research on the hotel industry has shown that both union and nonunion workers earn more in metropolitan areas where unions represent a large percentage of hotel workers than in areas where unions represent few workers. For example, wages in such hotel service occupations as cook, guest room attendant, baggage porter and front desk clerk are more than 40 percent higher in Las Vegas, where the extent of union representation is high, than in Reno, where it is low. According to our own analysis of CPS data for the 1996-2000 period, hotel workers receive a wage premium if they are located in metropolitan areas that other research has identified as areas with high rates of union representation in the top segments of their local hotel industries. Those metropolitan areas are Atlantic City, Boston, Chicago, Detroit, Honolulu, Las Vegas, Los Angeles, New York, San Francisco, and Washington, D.C. Our analysis shows that hotel workers earn 16.1 percent more per hour in those areas than in other parts of the country. This estimate takes into account workers� demographic, economic, and locational characteristics, including whether or not a worker is represented by a union. The extent of unionization in local areas makes a difference for hotel workers� wages because where unions represent a large percentage of hotel workers in a local area, collectively bargained wages set the standard for the local labor market. Nonunion employers have to pay wages at or near the union wage in order to attract workers. Nonunion employers that want to forestall unionization may also pay wages at or even above the union wage. Union Hotel Workers Are Disproportionately Male, Foreign-Born and Racial Minorities Hotel workers who are represented by unions differ markedly from their
nonunion counterparts (table 21). Union hotel workers are generally older
than nonunion workers. Most union hotel workers are men, while most nonunion
workers are women. Union workers are less likely to have completed high
school than nonunion workers. Nonunion workers are more likely to have
high school diplomas and more likely to have college degrees. (The larger
share of nonunion workers with college degrees may result, in part, from
the inclusion of managers in the nonunion category.) Compared to nonunion
workers, union workers are less likely to be white or black and more likely
to be Hispanic or members of other racial groups. Almost half of union
workers, but only about a quarter of nonunion workers, are foreign-born.
**Whites, blacks, Hispanics and members of other races are defined as mutually exclusive categories. This differs from Census Bureau definition, under which Hispanics may be of any race. ***Foreign-born are defined as all who are either non-citizens or naturalized citizens. Foreign-born do not include U.S. natives born abroad. The CPS does not have enough non-citizen union hotel workers to produce reliable estimates for that category. Source: WAI analysis of CPS ORG data. Union Workers More Likely to Work Standard Full-Time Schedules Union hotel workers are much more likely than their nonunion counterparts
to work standard full-time workweeks�at least 35 hours but less than 45
hours per week. Table 22 shows that 21.5 percent of nonunion workers, but
only 9.2 percent of union workers, work part-time (less than 35 hours per
week). While 14.2 percent of nonunion workers work long hours (45 or more
hours per week), only 2.4 percent of union workers do so. (Part of the
union-nonunion differential in long hours may be due to the inclusion of
managers in the nonunion category.) The percentage of part-time workers
was smaller in 2000 than in 1989 among both union and nonunion workers.
However, while the share of union workers working long hours dropped dramatically
from 7.4 percent in 1989 to 2.4 percent in 2000, the share of nonunion
workers working long hours was slightly higher in 2000 than in 1989.
**45 or more hours per week on all jobs. Source: WAI analysis of CPS ORG data on usual weekly work hours. Unions Benefit Non-White, Female, Less Educated and Foreign-Born Hotel Workers the Most Union workers earn more than nonunion workers in all demographic and occupational categories shown in table 23 below, but the union wage premium is highest for hotel workers in demographic groups that are most disadvantaged in the labor market: non-whites ($2.30 more per hour union than nonunion, or 28.8 percent more), women ($2.00, or 25 percent), workers with less than a high school diploma ($2.50, or 33.3 percent) and the foreign-born ($2.37, or 29.6 percent). The last column in the table shows adjusted union-nonunion wage differentials
in hotels, taking into account demographic, economic, and locational characteristics
that may affect wages. After taking these characteristics into account,
workers in the most disadvantaged demographic groups still receive the
greatest wage benefits from union representation.
*Adjustment based on regression controlling, as appropriate to each demographic category, for age, age squared, race, sex, education, marital status, whether or not the worker was foreign-born (i.e., either non-citizen or naturalized citizen), region, whether the worker lived in a metropolitan or nonmetropolitan area, metropolitan area size, occupation, and whether or not the metropolitan area was an area of high union density in the top segment of its hotel industry. Late 1990s=1996-2000. Data for 1996-2000 are combined to permit more reliable estimates. **Not significantly different from zero at 5 percent level of statistical significance. ***Black, 8.7 percent; Hispanic, 14.0 percent; other races, 13.1 percent. ****Less than high school diploma, 14.6 percent; high school diploma only, 10.0 percent; some college, 7.7 percent; college graduate, not significantly different from zero at 5 percent level of statistical significance. *****Occupations other than occupations shown in the table, bartenders, clerks, janitors, laundry workers, and managers. Although there are hotels throughout the United States, hotel jobs make up a large share of total employment in only a few metropolitan areas. Most but not all of these regions are major tourist destinations. In these regions, wage growth has generally been relatively rapid, hotel establishments are larger than elsewhere and union representation is often high. However, only one of these regions (Las Vegas) has an average hotel wage that is high enough to support a single parent with one child. Hotel Employment a Large Share of Total in Only a Few Metropolitan Areas For each of the 20 metropolitan areas with the most hotel jobs in 2000, table 24 shows the number of hotel jobs and the percentage of all jobs in the metropolitan area that are hotel jobs. Even among the top 20 hotel metropolitan areas, only a few areas have very high shares of hotel employment. Atlantic City, Honolulu, Las Vegas, Orlando, and Reno have 5 percent or more of their jobs in the hotel industry. Las Vegas and Atlantic City have one-quarter and one-third, respectively, of their total employment in the hotel industry. In all five of these metropolitan areas, tourism is a mainstay of the local economy. Hotel employment in each of the top 20 hotel metropolitan areas is at least 1 percent of total metropolitan employment. Most of these metropolitan areas have hotel employment shares greater than the overall U.S. share of 1.4 percent. The location quotient is another way to measure the importance of the hotel industry in a local area. The location quotient is the ratio of an industry�s percentage of local employment to its percentage of nationwide employment. A location quotient of 1.0 indicates that an industry�s percentage of local employment is the same as its percentage of overall U.S. employment. A hotel location quotient greater than 1.0 suggests that a local area draws in a relatively large number of tourists from other metropolitan areas and thus has a higher than average share of tourism-related employment. Most of the top 20 hotel metropolitan areas have location quotients above 1.0 (figure 10). The metropolitan areas in which hotel employment makes up the largest shares of total employment also have the largest location quotients. Houston has the lowest location quotient (0.7) of these 20 metropolitan areas. Even New York and Los Angeles, which have many out-of-town visitors, have relatively low location quotients because out-of-town visitors are relatively less important to their local economies than to the economies of other areas.
Source: WAI analysis of BLS ES-202 data. Rapid Hotel Job Growth in Most of 20 Largest Hotel Metropolitan Areas in 1990s Data in table 25 show that from 1989-2000, six of the 20 metropolitan
areas with the most hotel jobs had hotel employment growth above the 16.7
percent national average: Boston, Las Vegas, Orlando, Reno, San Diego and
Washington, D.C. Las Vegas far outpaced all of the other 19 metropolitan
areas, adding 84,286 jobs from 1989 to 2000 and almost doubling its hotel
employment. Orlando also experienced a large employment increase (more
than 40 percent) in the hotel industry in the 1990s. However, three major
hotel centers lost hotel jobs since 1989: Honolulu, Los Angeles, and Tampa,
Fla. In the second half of the 1990s, hotel employment growth was particularly
strong in Riverside, Calif., Orlando, Miami and Las Vegas.
Note: NA=not available. Source: WAI analysis of BLS ES-202 data. Average Hotel Size Larger in Major Hotel Areas Than U.S. Hotel Average, but Declined in 1990s Table 26 shows that for all of the 20 largest metropolitan hotel areas
except Riverside, the average hotel employs more workers than the all-establishments
national average of 36. In the five metropolitan areas with the highest
hotel shares of local employment�Atlantic City, Honolulu, Las Vegas, Orlando
and Reno�hotels average more than 100 employees each. Las Vegas (474) and
Reno (219) have much larger average hotel sizes (that is, more employees
per establishment on average) than any other metropolitan areas. In the
1990s, 13 of the 20 metropolitan areas experienced declines in average
hotel size, with Honolulu and Houston seeing declines of more than 45 percent.
Of the six metropolitan areas with increases in average hotel size in the
1990s�Atlantic City, Las Vegas, Miami, New York, Orlando and Reno�only
Reno and New York saw increases of more than 40 percent. The two metropolitan
areas with the largest average hotel size in 2000, Las Vegas and Reno,
had the largest absolute increases in average hotel size in the 1990s,
103 and 66 employees per hotel, respectively.
Note: NA=not available. Source: WAI analysis of BLS ES-202 data. Except in Las Vegas, Hotel Wages Are Too Low to Support a Single Parent and One Child Except in Las Vegas, the average annual hotel wage in each of the top
20 hotel metropolitan areas was too low to enable a one-parent, one-child
family to afford the basic necessities of life. (We used the average wage
rather than the median wage, which better represents the wage of a typical
worker, because median wages for metropolitan areas cannot be estimated
reliably. Because median wages are generally lower than average wages,
our analysis in this section actually paints an overly optimistic picture
of the adequacy of a typical hotel worker�s wage.) We compared the average
annual hotel wage in each of the top 20 hotel metropolitan areas with the
basic family budget for a one-parent, one-child family in that metropolitan
area. The basic family budget, developed by Economic Policy Institute economists,
combines the costs of housing, food, child care, transportation and other
necessities, plus taxes. It measures the income that a family would need
in order to afford a basic, not luxurious or even comfortable, standard
of living. In Las Vegas, the average annual hotel wage in 2000 was 102
percent of the basic family budget for a single parent with one child.
Among the other top 20 hotel metropolitan areas, this percentage ranged
from about 61 percent in Boston to about 99 percent in New York (table
27). There are some hotel jobs that pay more than the basic family budget,
and workers who earn much of their income in the form of tips (which may
not be included in the average wage data) may earn considerably more than
the basic budget. Nevertheless, our findings about average hotel wages
are discouraging for those who would look to the hotel industry as a place
where people leaving welfare can become self-sufficient.
Source: WAI analysis of BLS ES-202 data on average annual hotel wages, and of basic family budgets in Heather Boushey et al., Hardships in America: The Real Story of Working Families (Washington, D.C.: Economic Policy Institute, 2001), table A4.1. Basic family budgets converted to 2000 dollars using the CPI and rounded to the nearest dollar. Seventeen of the top 20 hotel metropolitan areas experienced average annual wage growth in hotels of 10 percent or more from 1989 to 2000 (table 28). Hotel workers in Honolulu experienced the largest wage gains from 1989 to 2000 of workers in any of these metropolitan areas; their (inflation-adjusted) average annual wages went up by more than $12,000, or about 76 percent, during that period. Average annual wages in Atlanta, New York, and Washington, D.C., also increased by more than 30 percent in the 1990s. Only in Atlantic City did average wages decline during the 1990s as a whole. However, these findings do not necessarily mean that most hotel workers
in the top 20 hotel metropolitan areas received large wage increases. The
average wage, unlike the median wage that we presented in our national-level
analyses of hotel wages, is very sensitive to the wages of the highest-paid
workers. If wages rise substantially at the top, then the average can increase
substantially even if the wages of the typical worker grow more slowly
or not at all, or even if the typical worker�s wages decline. (That is
why the median wage, which we cannot estimate reliably for metropolitan
areas, is a better measure of the typical worker�s wage.) The data presented
in tables 4 and 5 above show that, at the national level, the wages of
high-wage hotel workers grew faster than the median hotel wage during the
1990s, perhaps because of the expansion of management jobs in the industry.
If this also occurred in major hotel metropolitan areas, then the increase
in average hotel wages overstates the increase in the typical hotel worker�s
wage.
Note: NA=not available. Source: WAI analysis of BLS ES-202 data. Hotel Job Growth Strong in Western States, Weak in Northeast State-level data can show what has happened to hotel jobs outside of the top hotel metropolitan areas. Hotel employment grew rapidly in some southern and western states in the 1990s. Mississippi, with hotel job growth of 350 percent, or 27,668 jobs, had by far the largest increase in hotel employment in the 1990s. Nevada (68.9 percent) and Utah (58.9 percent) also experienced very large percentage increases in hotel jobs in the 1990s. In 18 states, employment growth during that decade exceeded the national rate of 16.7 percent (appendix table 1). Of these 18 states, nine were in the west: Alaska, Colorado, Idaho, Montana, Nevada, New Mexico, Oregon, Utah and Wyoming. All the Rocky Mountain states except Arizona had hotel job growth rates in excess of the national rate during the 1990s. Five of the seven states that lost hotel jobs in the 1990s were in the northeast: Connecticut, Delaware, Massachusetts, New Jersey and Pennsylvania. All the northeastern states had hotel job growth rates below the national rate during the 1990s. Hotel Wages in Most States Below U.S. Average Only nine states and the District of Columbia had average annual hotel wages above the U.S. hotel industry average of $20,419 in 2000 (appendix table 2). New York, the District of Columbia, Maryland, Hawaii, Nevada and New Jersey all had average annual hotel wages above $25,000. All of these states contain at least part of a metropolitan area that is in the top 25 hotel metropolitan areas. In terms of wage growth in the 1990s, Mississippi and Maryland experienced the largest percentage gains, 82.8 percent and 61.3 percent, respectively. Alaska, New Jersey and South Dakota had small declines in annual hotel wages in the 1990s. Union Representation Is Concentrated in a Few States and Metropolitan Areas Hotel union representation is very unevenly distributed geographically. In the late 1990s, the percentage of workers represented by unions was highest in Hawaii, Nevada, New York, New Jersey, Illinois, California, Rhode Island, the District of Columbia, Alaska and Washington. These states had 85.6 percent of all union hotel workers. (Nevada alone had nearly a third of all union hotel workers.) Of the ten metropolitan areas identified in previous research as having high rates of union representation in the top segment of their hotel industries�Atlantic City, Boston, Chicago, Detroit, Honolulu, Las Vegas, Los Angeles, New York, San Francisco and Washington, D.C.�all but Boston and Detroit are in the states with the highest rates of union representation. A More Detailed Analysis of Hotel Jobs and Workers in Five Major Tourist States We are unable to provide more detail on hotel employment in metropolitan areas because the CPS is generally not designed to produce reliable estimates at the metropolitan-area level. Moreover, the CPS does not have a large enough sample of hotel workers in most states to permit a detailed state-by-state analysis of hotel workers and their jobs that would be comparable to the one presented in this report for the nation as a whole. However, the CPS does have enough hotel workers to enable us to perform such an analysis for five major tourist states�New York, Florida, Nevada, California, and Hawaii�using combined data for the late 1990s. Almost all Nevada hotel workers work full-time. Nevada has an
extremely low percentage of hotel workers who work part-time�only 6.4 percent
(table 29). Hawaii also has relatively few part-time hotel workers (11.8
percent). The New York and California hotel industries have shares of part-time
employment that are near the national hotel industry averages for the late
1990s. Hotel workers in Nevada, California, and Hawaii are much less likely
than their counterparts nationally to work long hours.
**Less than 35 hours per week on all jobs. ***45 or more hours per week on all jobs. Source: WAI analysis of CPS ORG data on usual weekly work hours. Data for multiple years were combined because the CPS does not have enough observations for all relevant regions to permit reliable estimates for a single year. Hispanic and immigrant workers make up large shares of the hotel workforce in New York, Florida, Nevada, California, and Hawaii. All five states have larger percentages of Hispanics in their hotel workforces than did the national hotel workforce in the late 1990s (table 30). New York and Florida also have large percentages of black workers. Except in Nevada, fewer than half of hotel workers in these states are white. All five states have very high percentages of foreign-born hotel workers and a majority of hotel workers in California are foreign-born. Florida, California and Hawaii have very high percentages of non-citizens in their hotel workforces. In New York and Hawaii, but not in the other three states, most foreign-born hotel workers are U.S. citizens. All five states have smaller percentages of hotel workers who are age
16-20 and 55 or older than the national averages for these years. A majority
of hotel workers in California and Hawaii are men, while most hotel workers
nationwide are women. Florida and California have very high percentages
of workers with less than a high school diploma, while Hawaii has a very
low percentage of such workers in its workforce. Nevada and Hawaii have
very high percentages of workers with high school diplomas or some college.
**CPS does not have enough observations in these categories to permit reliable estimates. **Whites, blacks, Hispanics and members of other races are defined as mutually exclusive categories. This differs from the Census Bureau definition, under which Hispanics may be of any race. ***Foreign-born are defined as all who are either non-citizens or naturalized citizens. Foreign-born do not include U.S. natives born abroad. Source: WAI analysis of combined 1996-2000 CPS ORG data. Data for multiple years were combined because the CPS does not have enough observations for all relevant regions to permit reliable estimates for a single year. Hotel workers earn higher wages in New York, Nevada, and Hawaii. New
York, Nevada and Hawaii have median hotel wages well above the national
hotel medians for the late 1990s, while Florida hotel wages were substantially
below the national hotel medians (table 31). (The national median wage
for hotel workers in 2000 was $8.62). The relatively high wages of hotel
workers in New York, Nevada and Hawaii may be due, in part, to their high
rates of hotel union representation. The wage gap between high- and low-wage
hotel workers in New York was above the national averages for the late
1990s, while this gap was below average in Florida, California, and Hawaii.
**Low-wage earners are defined as those who earn more than 10 percent of all workers and less than 90 percent. ***High-wage earners are defined as those who earn more than 90 percent of all workers and less than 10 percent. Source: WAI analysis of combined 1996-2000 CPS ORG data. Data for multiple years were combined because the CPS does not have enough observations for all relevant states to permit reliable estimates for a single year. Union hotel workers have a very large wage advantage in New York.Hawaii, Nevada and New York have very high rates of union representation, while Florida has very low union representation. The union-nonunion wage differential (unadjusted for workers� demographic, economic, and locational characteristics) is very high in New York and higher than the national average in California. The union-nonunion wage differential is almost nonexistent in Nevada, and nonunion workers actually earn more (unadjusted) in Hawaii. It is possible that the relative lack of union wage effects in the hotel industry in Nevada and Hawaii results from nonunion hotels paying wages at or above union levels in the hope that this will forestall unionization. Such behavior by nonunion employers may be most common where, as in Hawaii and Nevada, the rate of union representation in the industry is extremely high. The last row of table 32 adjusts the union-nonunion wage gap for workers�
demographic, economic, and locational characteristics. The adjusted union
wage differential is lower than the unadjusted differential in New York
and California, but it is still substantial in both states. (The very large
difference between the adjusted and unadjusted union wage differentials
in New York may reflect the difference between generally high wages in
the New York City metropolitan area, where unions represent many hotel
workers, and generally lower wages elsewhere in the state, where unions
represent few hotel workers.) In Nevada, on the other hand, the union wage
differential actually increases from 0.6 percent (unadjusted) to 7.2 percent
after adjusting for worker characteristics. Thus, there is a union effect
in Nevada, albeit smaller than that in New York and California. In Hawaii,
there is no statistically significant difference between the wages of union
and nonunion hotel workers once workers� characteristics are taken into
account.
**The CPS did not contain enough union hotel workers in Florida to permit reliable estimates of union wages or the union-nonunion wage gap for that state. ***Percent by which union median wage exceeds nonunion median wage. ****Adjustment based on regression controlling for age, age squared, race, sex, education, marital status, whether or not the worker was foreign-born (i.e., either non-citizen or naturalized citizen), region, whether the worker lived in a metropolitan or nonmetropolitan area, metropolitan area size, occupation and whether or not the metropolitan area was an area of high union density in the top segment of its hotel industry. Data for 1996-2000 are combined to permit more reliable estimates. ****Not significantly different from zero at 5% level of statistical significance. Source: WAI analysis of combined 1996-2000 CPS ORG data. Data for multiple years were combined because the CPS does not have enough observations for all relevant states to permit reliable estimates for a single year. |
|||||||||||||||||||||||||||||||||||||||||||||||||||||||||||||||||||||||||||||||||||||||||||||||||||||||||||||||||||||||||||||||||||||||||||||||||||||||||||||||||||||||||||||||||||||||||||||||||||||||||||||||||||||||||||||||||||||||||||||||||||||||||||||||||||||||||||||||||||||||||||||||||||||||||||||||||||||||||||||||||||||||||||||||||||||||||||||||||||||||||||||||||||||||||||||||||||||||||||||||||||||||||||||||||||||||||||||||||||||||||||||||||||||||||||||||||||||||||||||||||||||||||||||||||||||||||||||||||||||||||||||||||||||||||||||||||||||||||||||||||||||||||||||||||||||||||||||||||||||||||||||||||||||||||||||||||||||||||||||||||||||||||||||||||||||||||||||||||||||||||||||||||||||||||||||||||||||||||||||||||||||||||||||||||||||||||||||||||||||||||||||||||||||||||||||||||||||||||||||||||||||||||||||||||||||||||||||||||||||||||||||||||||||||||||||||||||||||||||||||||||||||||||||||||||||||||||||||||||||||||||||||||||||||||||||||||||||||||||||||||||||||||||||||||||||||||||||||||||||||
| The
Industry�s Experience in Recession and Since Sept. 11
The hotel industry has received a great deal of publicity in recent months because of the drop-off in travel and tourism during the recession and especially after the Sept. 11 terrorist attacks. This section uses recent data from the Bureau of Labor Statistics and private hotel industry research sources to show how those events affected the industry and its workers. Like most earlier sections of this report, this section presents data about all hotel and motel employees, regardless of occupation or location. As of May 2002 (the latest month for which final national employment data were available at the time this report was written), hotels and hotel workers were not yet seeing any improvement in the number of jobs. No Recovery Yet for Hotel Jobs The recession and the Sept. 11 terrorist attacks hit hotel employment hard and, as of May 2002, there were still fewer hotel jobs than at the beginning of the recession. From the beginning of the recession in March 2001 through May 2002, hotel industry employment declined by 122,000 jobs, or 6.4 percent. Of those lost jobs, 63,000 were lost since September 2001, reflecting the combined effects of the September attacks and the recession. The effects of the September attacks show up most clearly in the precipitous loss of 38,000 hotel jobs between September and October 2001, the largest single-month job loss during the recession. Employment fell in every month from March through December 2001, rose by 6,000 jobs between December 2001 and January 2002, then remained stable from January through March 2002. From March through May 2002, though, hotel employment fell again, more than wiping out the small December-to-January gain (figure 11). |
Note: Data are for hotels and other lodging places; hotels
and motels make up about 96 percent of all
employment in this industry category. Data are seasonally
adjusted.
.
| Hotel Unemployment Increased More Than U.S. Rate from September
to December 2001 and More Than in Same Months in 2000
Unemployment data also show a large effect of the recession on hotel workers. Unemployment for hotel workers climbed from 5.2 percent in 2000 to 7.0 percent in 2001. This 1.8 percentage point increase was much larger than the rise of 0.8 percentage points for all U.S. workers between 2000 and 2001 (figure 12).
In 2001, the hotel industry had an increase in its unemployment rate
from March (the beginning of the recession) to December, while there was
a sizeable decrease in hotel industry unemployment during the corresponding
months of 2000 (table 33). The unemployment rate for all U.S. workers likewise
rose by 0.8 percentage points in the same period, but hotel workers were
hit harder than U.S. workers overall, as the unemployment rate rose relatively
more for hotel workers than for U.S. workers compared to the same period
in 2000. From September to December 2001, hotels had only a slightly greater
increase in the unemployment rate than in same months of 2000. In contrast,
U.S. workers as a whole had an increase in the unemployment rate from September
to December 2001 but a small decline in the unemployment rate during the
same months of 2000.
Source: WAI analysis of CPS basic monthly survey data. The hotel industry generally has a higher unemployment rate than the U.S. overall. In 2000 and 2001, hotel workers� unemployment rate exceeded that for all U.S. workers except for two months in 2000. Unemployment rates in the hotel industry in 2000-2001 ranged from a low of 3.0 percent (September 2000) to a high of 9.0 percent (December 2001), while the unemployment rate for the U.S. overall in this period ranged from 3.6 percent (October 2000) to 5.4 percent (December 2001). (Because hotel industry unemployment rates are not seasonally adjusted, the corresponding U.S. overall unemployment rates presented here are also not seasonally adjusted.) Nearly All Major Hotel Metropolitan Areas Experienced Hotel Job Losses in Last Year Table 34 provides data on recent hotel employment and changes in hotel employment for 19 of the 20 metropolitan areas with the most hotel employment. (The table lists metropolitan areas in order of their March 2001 to March 2002 hotel percentage job loss or gain.) These data are not seasonally adjusted. (See section above on hotel unemployment.) However, since we are comparing the same month in two years (thus controlling for seasonal variation), we can compare the employment in these metropolitan areas without adjusted data. 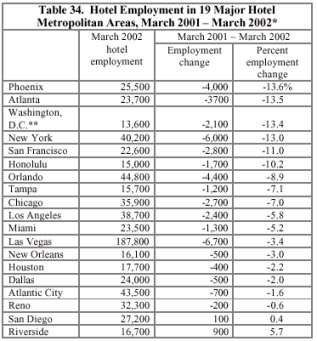 **Washington, D.C., data are for District of Columbia only. Washington, D.C., metropolitan area data are not available Note: Metropolitan areas shown are 19 of the 20 metropolitan areas with the largest hotel employment. Boston data are not available. Data are not seasonally adjusted. Source: WAI analysis of BLS Current Employment Statistics data. Ten of the top 20 hotel employment metropolitan areas had percentage job losses greater than the national average (5.3 percent) from March 2001, when the recession began, to March 2002: Phoenix, Atlanta, Washington, New York, San Francisco, Honolulu, Orlando, Tampa, Chicago, and Los Angeles. While Las Vegas lost the most hotel jobs from March 2001 to March 2002, 6,700 jobs, this amounted to only 3.4 percent of its hotel jobs, which placed it below the national percentage. New York, Orlando, and Phoenix each lost 4,000 or more jobs from March 2001 to March 2002. Only San Diego and Riverside avoided job losses from March to March. Large Occupancy Losses in Top Segments of the Industry, but Room Rates Fell Only Slightly All segments of the industry saw occupancy decline during 2001, but occupancy fell by a greater percentage in the upper segments of the industry than in the lower segments (table 35). Because the recession and Sept. 11 probably affected business- and long-distance vacation-related hotel stays more than other kinds of hotel stays, larger occupancy declines in the top segments were to be expected. Although employment data are not available by industry segment, the occupancy data suggest that hotel job losses may have been greater, in percentage terms, in the upper segments. Despite occupancy losses, hotels in the top segments of the industry
reduced their room rates only slightly during 2001 (table 36). The average
daily room rate actually rose in the upscale segment, even after adjusting
for inflation. In contrast, room rates dropped sharply in the two lowest
segments of the industry. Hotels in those segments were apparently able
to stave off large occupancy losses by cutting their prices.
Source: WAI analysis of Smith Travel Research data.
This report has highlighted both positive and negative features of hotel employment. The hotel industry has relatively strong employment and wage growth, many entry-level jobs, opportunities to create career ladders, the relative absence of extremely long work hours, and relative stability of employment within the industry and its occupations (although not within individual hotels). However, we have identified several features of hotel jobs that are in need of improvement: low wages and many poverty-wage jobs, wages that are insufficient to support a single parent and child in nearly all major hotel metropolitan areas, absence of career ladders for many low-wage workers (despite the opportunities that exist to create them), growing wage inequality, falling employee benefits, many part-time jobs and a relatively large amount of involuntary part-time work, high job turnover and high occupational injury rates. Solving these problems requires public policies that will support union and employer efforts to promote the high road and block the low road in the industry. The following are some policies that could achieve these goals. Provide Government and Foundation Funding to Multi-Employer Partnerships in the Industry Individual hotel employers, acting alone, are often unable to raise productivity, improve working conditions, reduce turnover, or train workers in skills that are useful throughout the industry. Their difficulties include lack of knowledge, the fear that other employers will hire away workers that they have trained, and widespread low-road competition from employers that compete on the basis of low wages and do not systematically try to raise productivity. If employers in the industry work together, though, they can overcome these obstacles. Because hotel workers have much of the knowledge that is needed to solve employers� problems, multi-employer partnerships in the industry should include worker participation. Three existing multi-employer hotel partnerships illustrate the some of the ways in which partnerships can improve hotel jobs. In Atlantic City, casino hotels and Local 54 of the Hotel Employees and Restaurant Employees Union (HERE) have worked together to create an apprenticeship program to train chefs. In the San Francisco Hotels Partnership, downtown hotels at the high end of the industry work with HERE Local 2 to train line workers and managers in resolving labor-management conflicts, reducing the labor turnover that those conflicts often cause. Las Vegas� Culinary Training Academy, a non-profit organization formed by HERE Local 226 and major hotel casinos, trains hotel workers, helps place them in jobs, and through its training and placement efforts, helps workers advance within the industry. The activities of all three partnerships both benefit workers directly and help raise hotel productivity. Government funding could facilitate the formation of similar partnerships in other major hotel centers. Funding from foundations, particularly those that are concerned about the well being of low-wage, minority, or immigrant workers, could do so as well. These partnerships could help reduce the high rates of labor turnover that are unproductive and costly to both workers and employers. In addition to providing labor-management dispute resolution training, some other ways that partnerships might help reduce turnover are to find ways to improve job safety, redesign jobs to make better use of worker skills and explore ways to reduce the number of part-time jobs. At the same time, multi-employer partnerships are ideally situated to help workers make productive career moves from one hotel to another in cases where it is difficult or impossible for them to advance within a single hotel. Partnerships could promote multi-employer careers by working to make job definitions and skill requirements more uniform among hotels in a local area, training workers in skills that are useful throughout the industry but not specific to a single employer (such as cooking), and establishing portable pensions, health insurance and other employee benefits. The fact that hotel workers typically stay within the hotel industry even though they often change employers makes it desirable for partnerships to address these issues. Raise Wages for Low-Wage Workers: Minimum Wage, Living Wage Laws and Job Quality Standards on Publicly Financed Hotel Projects Rapid hotel productivity growth is a necessary foundation for rapid wage growth over the long term, but by itself it is not sufficient. Public policy should also raise wages for low-wage workers in more direct ways. Raising the wages of low-wage workers directly would benefit many hotel workers, reduce the number of hotel jobs that pay poverty-level wages, help reverse the growth of wage inequality in the industry and reduce labor turnover. Increasing federal and state minimum wages could benefit many hotel workers. Minimum wage increases benefit not only workers who earn less than the amount to which the minimum wage is increased, but also other low-wage workers who earn slightly more than the minimum wage. The 10 percent of hotel workers who earn less than $5.56 per hour (just 41 cents above the current federal minimum wage) would benefit from a minimum wage increase. Since the median hotel wage is only $8.62, other hotel workers could also benefit. Research has shown that modest increases in the minimum wage can benefit low-wage workers without causing job losses. Local living-wage ordinances, which require companies that have government contracts or (in some cases) companies that receive government economic development subsidies to pay a wage higher than the federal or state minimum wage, could improve the quality of hotel jobs in the same way that a minimum wage increase could. Because hotels that are built as part of downtown redevelopment projects often receive public economic development subsidies, living-wage ordinances have the greatest potential to raise hotel wages if they cover subsidy recipients as well as government contractors. For the same reason, governments at all levels should include minimum job quality standards, including wages above the federal and state minimum wages, as a condition for economic development assistance, even where no living wage ordinances exist. Protect Workers� Right to Form and Join Unions Unions raise hotel workers� wages and reduce wage gaps by age, race, sex, education and immigration status. They are of the most benefit to hotel workers who belong to demographic groups where wages are otherwise lowest. Yet some employers continue to thwart workers� right to organize by firing union supporters, intimidating workers or threatening to close establishments. In the hotel industry, outsourcing of food and beverage and cleaning jobs to non-hotel employers can also deprive workers of union representation that they may have previously chosen (as well as reduce their wages), unless appropriate safeguards are put in place. Integrate Education, Training, Workforce Development and Career Path Development More Fully into Welfare Reform Unless carefully designed, "work-first" welfare reform has the potential to drive down the wages of all low-wage workers by forcing more people into competition for low-wage jobs. It also has the potential to trap workers in jobs from which there is little opportunity to advance, or to promote the endless cycling of workers from one low-wage job to another. These concerns are especially important for the hotel industry, where many workers already earn poverty-level wages, wages in major metropolitan areas are generally insufficient to support a single parent and child, turnover is already high, and pathways of advancement are not equally available to all workers. States vary greatly in the extent to which they allow or encourage welfare recipients to pursue education or training in conjunction with work. Few states have made efforts to encourage low-wage workers to take jobs that have real advancement possibilities, or to encourage employers to create career paths by which low-wage workers may advance. Allowing education and training to count as a major part of a welfare recipient�s allowable work activity helps individual workers to advance and relieves some of the downward pressure that a "work first" policy places on the wages of low-wage workers. Because higher labor turnover often accompanies lower wages, such a policy also helps workers and employers avoid the burdens of increased turnover. Linking welfare reform to structured advancement pathways can help ensure that welfare recipients who start out in low-wage jobs do not have to remain in those jobs indefinitely. Such linkages would help welfare reform to achieve its goal of promoting self-sufficiency through work. Require Wage and Benefit Parity for Part-Time and Full-Time Workers Although part-time work in the hotel industry has been on the decline, the industry still has a larger than average share of jobs that are part-time. Part-time workers in the hotel industry are almost twice as likely as part-timers in the United States overall to be working part-time involuntarily. Part-time jobs generally pay lower wages than full-time jobs. (In the hotel industry, CPS ORG data show that part-time workers� median hourly wage in 2000 was about 71 percent of full-timers� median hourly wage.) In addition, part-time jobs often lack pensions, health insurance, and other employee benefits. Because part-time workers cost less than full-timers, part-time employment can be part of a low-road competitive strategy. At the same time, hotel guests� needs for certain kinds of services (such as restaurant meals) can vary greatly over the course of a day or week, making some part-time work necessary even in high-road hotels. Therefore, public policy should not try to eliminate all part-time jobs, but it should discourage part-time jobs that exist simply as a way of lowering wages and benefits. Employers should be required to provide part-time workers with wages and benefits that are as good (on an hourly basis) as those they provide to full-timers who do equivalent work. Collect Detailed Industry Data Where Hotels Are Especially Important to the Local Economy In states such as Nevada and Hawaii, the hotel industry makes up such large shares of output and employment that it affects the well being of the entire state. In others, such as New Jersey, there are localities in which the industry is of similar public importance. In these states and localities, the economic importance of the industry gives the public an interest in assessing the economic and labor market performance of the industry. Yet many of the kinds of detailed industry-level data on wages, work hours, and workforce demographics that we present in this report�and that are essential to evaluating the performance of the industry�are not available on an ongoing basis for such states and localities. The Current Population Survey sample is too small to provide much of this information at the state level, even in the five states for which we were able to report some data, and it is not representative of metropolitan areas. The U.S. Census provides some of this information for states and localities, but it is only conducted once every ten years and data may be several years old by the time they are released. Private data sources do not collect many of the necessary data. Some data, such as those on occupational illnesses and injuries, are only available at the national level. No labor market data are available for different segments of the industry, despite the fact that the differing competitive pressures that hotels in those segments face make it likely that job characteristics will differ by industry segment. Hotel industry and workforce data comparable to those presented in this report should be collected regularly for states and metropolitan areas for which the industry is of major economic significance. Any state or metropolitan area for which the location quotient of hotel employment is greater than 1.0 for five consecutive years should be included. In such places, the hotel industry is important not only because it has a large effect on employment and income, but also because hotels are a major "export" industry for the region, contributing to the region�s prosperity by drawing in many tourists from other parts of the country. The federal government could collect the necessary data as a supplement to its existing programs (such as the Current Population Survey), the affected states could collect the data themselves, or a joint federal-state data collection program could be implemented. Regardless of how the costs are split between federal and state governments, the rationale for incurring those costs is that the public needs to be able to assess the performance of any industry that has a major economic impact on a state or locality. Appendix: Hotel Labor Market
Data for the States
.
AFL-CIO Working for America Institute�s Research Director Dr. Howard Wial and Economic Analyst Jeff Rickert wrote this report with support from many people in many organizations. Among those who provided invaluable comments on earlier drafts of the report were Tom Snyder, Matthew Walker, Lee Strieb and Steve Shertel of the Hotel Employees and Restaurant Employees Union; Stephen Herzenberg and David Bradley of the Keystone Research Center; Jeff Waddoups of the University of Nevada, Las Vegas; Annette Bernhardt of New York University; and Institute staff Teri Bergman and Alec Meiklejohn. David Bradley and Matthew O�Gara provided research assistance. Danielle Gao of the Economic Policy Institute provided WAI with the Current Population Survey micro-data sets that formed the basis of much of the statistical analysis of hotel jobs and workers. Annette Bernhardt and Jeff Waddoups were kind enough to share their recent unpublished reports on hotel industry employment and their reflections on a number of important analytical issues. Mike Kiernan, Pat Reilly and Jean Pierce of the Institute provided editorial and production assistance. This report was funded by grants from the Ford Foundation and Annie E. Casey Foundation and Grant No. AN-10319-00-60 from the U.S. Department of Labor Employment and Training Administration. Nancy Mills, Executive Director
1 Paul Ingram, The Rise of Hotel Chains in the United
States, 1896-1980 (New York :
|
||||||||||||||||||||||||||||||||||||||||||||||||||||||||||||||||||||||||||||||||||||||||||||||||||||||||||||||||||||||||||||||||||||||||||||||||||||||||||||||||||||||||||||||||||||||||||||||||||||||||||||||||||||||||||||||||||||||||||||||||||||||||||||||||||||||||||||||||||||||||||||||||||||||||||||||||||||||||||||||||||||||||||||||||||||||||||||||||||||||||||||||||||||||||||||||||||||||||||||||||||||||||||||||||||||||||||||||||||||||||||||||||||||||||||||||||||||||||||||||||||||||||||||||||||||||||||||||||||||||||||||||||||||||||||||||||||||||||||||||||||||||||||||||||||||||||||||||||||||||||||||||||||||||||||||||||||||||||||||||||||||||||||||||||||||||||||||||||||||||||||||||||||||||||||||||||||||||||||||||||||||||||||||||||||||||||||||||||||||||||||||||||||||||||||||||||||||||||||||||||||||||||||||||||||||||||||||||||||||||||||||||||||||||||||||||||||||||||||||||||||||||||||||||||||||||||||||||||||||||||||||||||||||||||||||||||||||||||||||
|
Nancy Mills Executive Director AFL-CIO Working for America Institute 815 16th Street, NW Washington, DC 20006 Phone: 1-800-842-4734 http://www.workingforamerica.org/ |