|
Year End 2000
For insight on this issue, we interviewed Elliott Pollock, President
of the economic consulting firm Elliott D. Pollack & Associates. Mr.
Pollack specializes in real estate economics and served for fourteen years
as the chief economist at Valley National Bank. We also interviewed a number
of hotel general managers and CVB representatives in Phoenix and Tucson.
Here�s what we found out.
National Economy As of the end of 2000, the economic expansion was in its 117 th month, making it the longest expansion in American history. Economic expansions, Mr. Pollack points out, do not die of old age. They die from unusual shocks, structural imbalances, and fiscal and monetary policy errors. The economy has suffered enough shocks and imbalances that a continued economic slowdown is an absolute certainty and a recession is a possibility. As described below, four factors are driving the slowdown. First was the precipitous drop in the NASDAQ last year. With the deflation of the �tech bubble� there has been a corresponding loss of confidence in the economy. In February 2001, the U.S. Consumer confidence index fell to 106.8, down from 115.7 in January. One year ago it stood at 140.8. The second factor is rising levels of consumer debt. Consumer debt as a percentage of total income is up from just under 12 percent during the early 1990�s to slightly more than 14 percent, which puts it at levels not seen since the mid-1980s. The third factor driving the slowdown in the economy is the low personal savings rate. Fueled, in part, by paper profits in the stock market, the personal savings rate dropped from about 8 percent in 1990 to �0.1 percent in 2000. Exacerbating the problem is the fact that consumers are saving less money outside of their IRA�s and 401K�s, which, as a practical matter, are funds that are inaccessible. The upshot is that they have less of a cushion in accessible savings. The final factor is a spike in oil prices. During the past two years, the price of oil rose from about $11 per barrel to more than $34 per barrel and now stands at approximately $30 per barrel. As a result, consumers are spending more of their disposable income on fueling their cars and heating their homes. As a result of the foregoing developments, consumers have cut back on their spending, which, in turn, has led to rising business inventories. Even with just-in-time delivery practices, it will take some time to work off the excess inventory. Just how long is unknown, but if the slowdown turns out to be a true inventory correction, or if consumer confidence continues to decline, then the economy is more likely to fall into recession. The February consumer confidence numbers are clearly cause for concern.
As was so succinctly explained in the February 9 th edition of The Kiplinger
Letter, consumers, who account for about 70 percent of the economy, may
be creating a self-fulfilling prophecy:
The Kiplinger Letter goes on to put some perspective on the matter by
comparing the economy at the end of 2000 with economic conditions in mid-1990,
before the last recession.
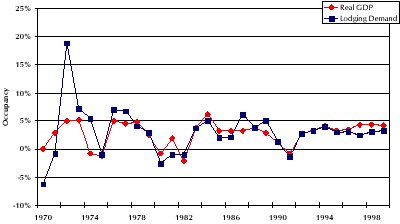
Returning to Mr. Pollack�s comments, he reports that declining interest rates and, hopefully, some form of retroactive tax relief will push things in the right direction. As it now stands, the consensus forecast among economists is for the United State�s gross domestic product (GDP) to grow by 1.9 percent during 2001, increasing to 3.5 percent in 2002. This compares to GDP growth of 5.1 percent in 2000. As detailed below, rooms demand correlates strongly with GDP. United States Lodging Market
Looking past this year, Mr. Pollack explains that the demographics underlying the American economy have never been stronger, meaning that the chance of a protracted recession is slight. The baby boom generation is moving into its peak earning and spending years. The number of people in the 45 � 64 age bracket is expected to rise substantially during the next decade. On average, people in this age bracket spend about $48 per day, as compared to about approximately $36 per day for people in the 25 � 44 age group. Most important from our perspective is that older people like to travel. Arizona Economy Arizona, Mr. Pollack explained, has enjoyed an economic boom that is unprecedented in length and strength. Among the most important factors driving the state�s economy are the following. First, is the underlying strength of the national economy. Second, are economic conditions in the states immediately surrounding Arizona, almost all of which have been among the strongest economies in the country. Third, are improvements in the economies of major international trading partners � Mexico and Asia, in particular. And fourth, is rising demand for the products produced by the many high-technology companies in the state. The net result is that, since 1993, Arizona has been one of the fastest growing economies in the nation, as reflected by the fact that it ranked second in the nation in employment growth during the 1990�s. Manufacturing, construction, and retail trade account for about 40 percent of employment in Arizona. Within the manufacturing sector, 43 percent of all jobs are generated by technology companies. Considering the present problems in the technology industry, this amounts to bad news. However, looking out a bit further, Mr. Pollack points out that it is better to be a bastion of the growing technology industry than to rely on industries that, in America, are in the later stages of their life cycle, such as automobiles, furnishings, and appliances. As indicated in the chart below, retail development is at its peak and the state is on the downside of the cycle with regard to office and apartment construction. Mr. Pollack is quick to point out, however, that this will be a normal market cycle rather than a repeat of the extraordinary conditions in Arizona�s real estate industry that existed at the start of the decade. In the event that there is a recession, employment in the retail industry can be expected to drop dramatically. The remaining 60 percent of the jobs in Arizona exist in trade, services, transportation, communications, public utilities, and FIRE (finance, insurance, and real estate). The outlook for these industries is slower, but continued, growth. The overall outlook for the state�s economy during 2001 is for continued growth, but at a slower pace. Given the intrinsic strength of the Arizona economy, Mr. Pollack is hard pressed to find a scenario � even one that includes a national recession �where the Arizona economy is dealt a serious blow. Mr. Pollack�s comments are in line with the December 2000 Arizona Blue
Chip consensus forecast, which forecasts the following figures for the
state�s economy and for the Phoenix and Tucson MSA�s.
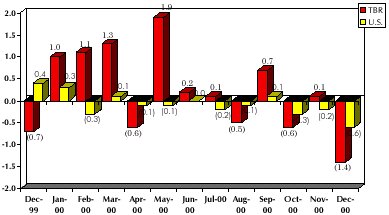
National Travel Trends For insight into the national outlook for travel, we turned to the Travel Business Roundtable (TBR). TBR is a coalition of more than 60 CEO�s representing all sectors of the travel and tourism industry. In addition to the major airlines, car rental companies, travel management agencies, and hotel chains, TBR�s membership roster includes companies such as The Coca-Cola Company, USA Today, TravelNow.com, the Taubman Company, and the International Council of Shopping Centers. The TBR Index of Leading Economic Indicators (TBR Index) was launched in 1997, following a TBR-sponsored analysis to gauge the economic impact of travel and tourism on the U.S. It is a composite of nine key travel, tourism, entertainment, and restaurant data measures representing all the major economic sectors of the travel industry. The composite TBR Index is a weighted computation of the month-to-month changes in each of the individual time series. Seasonal fluctuations are removed from these data before they are aggregated into the final index. The TBR Index is similar to The Conference Board�s U.S. Index of Leading Economic Indicators in the sense that it is designed to predict changes in the economy. The TBR Index and the U.S. Leading Indicators
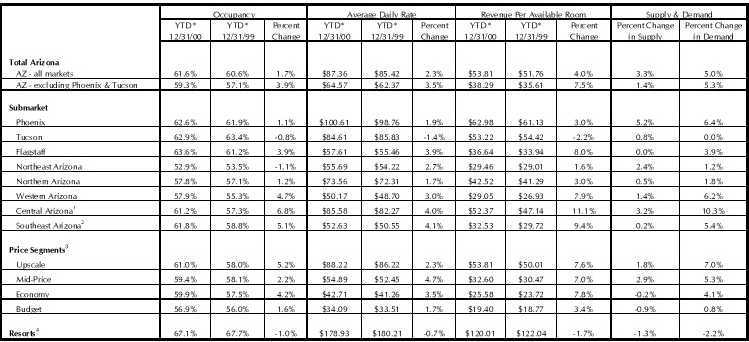
Reflecting the slower rate of growth in the economy, the TBR Index declined at a 1.4 percent seasonally adjusted rate in December 2000 (see chart below). During the same period, the U.S. Index of Leading Economic Indicators declined 0.6 percent. TBR�s interpretation of the decline is that it clearly points to a slowing in activity in the travel and tourism industry over the next six to 12 months. According to Dr. James Howell, economist and President of the Boston-based Howell Group, the 1.4 percent decline must be considered significant, especially when viewed within the context of the irregular - but clearly weakening - monthly rates of change in the Index since May. Nearly all of the operators we interviewed report that they are �cautiously optimistic� about prospects for the coming year �but, we judged, with more emphasis on the �cautious� than the �optimistic.� The wary attitude appears to have less to do with current performance and more to do with the drumbeat of bad news in the media. Most report relatively strong performance and booking paces that are at, or ahead, of last year. One of the people we interviewed put it best in saying, �If you didn�t read the newspapers, you wouldn�t think there was a serious problem.� Nearly all expect to see RevPAR growth of between 0 � 5 percent, with Valley operators predicting increases in the upper end of the range and Tucson operators tending toward the lower end. Almost everyone we spoke with reported a bit of softening in November, December and January, citing the cold and rainy Arizona weather and the �tech wreck� in the stock market that transformed many of the dot.coms into dot.bombs. Those who reported being hardest hit were the commercial hotels that depend on technology companies. There was a somewhat surprising disconnect between the General Manager�s comments and the Phoenix numbers, however. As shown below, during November 2000, the total number of occupied roomnights in metropolitan Phoenix was 7.7 percent higher than in November 1999, which was a rate of growth second only to that achieved in November 1997. Similarly, in December 2000, demand was an astounding 9.7 percent higher than in December 1999, which was by far the highest rate of growth during this time period. (A part of the extraordinary increase in December 2000 almost certainly has to do with decreases during December 1999 because of Y2K concerns.) We contacted Smith Travel Research for an early peek at the January 2001 numbers and found that that the story was pretty much the same � demand in January 2001 was 3.0 percent higher than in January 2000. In this case, however, the rate of growth in demand was relatively low as compared to historical rates of growth in demand during January, indicating that some slowing may, in fact, be occurring. In November, December and January, occupancy in metropolitan Phoenix was up by 3.9 percent, 6.6 percent, and 0.9 percent, respectively, as compared to the same months in the prior year. Percent Change in Demand 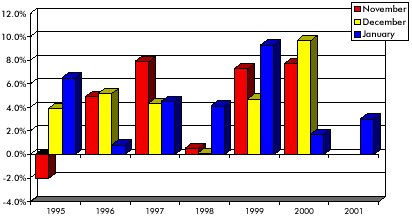
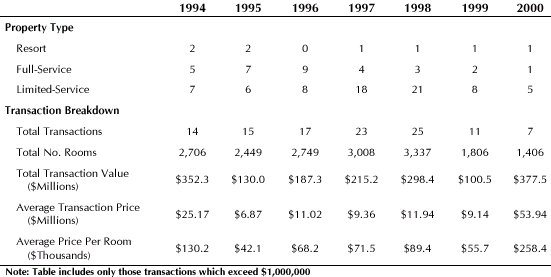
Source: Smith Travel Research Group hotels, which are less sensitive to the immediate ups and downs of the market, reported some attrition and a smattering of cancellations. Again, most of the problems are in the technology arena, with pharmaceutical, insurance, and other non-technology industries, as well as association business, remaining strong. Thus far, leisure business is holding steady. Nearly everyone believes that summer will tell the �real story.� Will vacation travelers turn out in droves or will they remain at home because of the economy? Only time will tell. When asked what things in 2001 are cause for optimism, most operators responded with, �The worst of the supply increases are behind us.� Another issue that was mentioned several times is the power problem in California, which we know to be affecting the operations and pricing. A number of the upscale and luxury hotels in Palm Springs are limited to cold menus several days per week and Starwood and Marriott recently announced that their west coast hotels will add a $2.50 power surcharge to the room rate. These developments have the potential to make Arizona hotels more competitive. Most of the pessimistic comments centered on the outlook for the economy. Also mentioned was the possibility of an airline strike. The nation�s four major airlines � American, United, Delta, and Northwest � face overlapping strike threats during the months of April, May, and June, although President Bush has stepped in to encourage the parties to enter into agreements so that the country will not have to endure a major strike, particularly while the economy is weak. Looking beyond this year, comments of concern mostly had to do with the coming completions of the Marriott Desert Ridge, Westin Kierland, and Sheraton Wild Horse Pass Resort, which together will add 2,200 rooms to the market. What�s It All Mean? Good news and bad news. Up-tics and down-tics. Optimism and caution. There are a lot of mixed signals on the foregoing pages. What�s it all mean? Were we able to give you a certain answer, we would be charging (a lot) for this newsletter. No one, not even Alan Greenspan, knows exactly how the economy will perform during the balance of 2001. Having said that, our bet is that Mr. Pollack is right on the mark. Continued slowing of the economy is a certainty and a recession � but not a protracted one � a possibility. Whichever way it goes, the Arizona economy, including its lodging industry, should weather it relatively well. Unfortunately, at just about the time that the supply binge has ended, the party is over for demand growth. During 2001, we will have to satisfy ourselves with slower rates of growth in demand and with minimal, if any, improvements in RevPAR. Statewide revenue per available room (RevPAR) increased by 4.0 percent in 2000. Occupancy increased by 1.7 percent, from 60.6 percent to 61.6 percent, and average daily rate (ADR), which stood at $87.36, improved by 2.3 percent. A very strong 5.0 percent increase in demand outpaced a 3.3 percent increase in supply. Central Arizona (excluding Phoenix) and Western Arizona led the way with demand growth rates of 10.3 percent and 6.2 percent, respectively. Flagstaff, with no new supply and 3.9 percent growth in demand, saw RevPAR increase by 7.9 percent. Demand in metropolitan Phoenix continued to grow at a blistering pace, achieving a seven-year high of 6.4 percent. For the first time in four years, the growth of supply, at 5.2 percent, was lower than the rate of growth in demand. The net effect was metro-wide RevPAR growth of 3.0 percent. Occupancy rose to 62.6 percent and the metro area ADR, at $100.61, broke through the century mark. With regard to demand, Scottsdale led the pack with a 7.6 percent rate of growth; it also achieved the highest rate of growth in RevPAR, at 5.0 percent. Tempe was the only sub-market to suffer a RevPAR decline, probably because of all the new limited-service product. The luxury and upscale segments, where supply and demand growth were nearly in balance, achieved RevPAR growth of 1.0 percent and 2.8 percent, respectively. In the resort sector, the upscale & mid-price resorts continued to fight the �ankle biters� (lower priced limited-service hotels, particularly the extended-stay products) and suffered a RevPAR decline of 1.5 percent for the year. Metropolitan Tucson had another flat year. Supply grew by less than one percent and the demand meter was stuck at zero. RevPAR fell by 2.2 percent. Tucson operators tell us that a big part of the problem is the loss of business to Phoenix. Where Tucson was previously able to compete on price, all of the new hotels in the Valley have made the Phoenix market more price competitive, as evidenced by the fact that demand at the Tucson resorts was down by 0.9 percent. The Central Tucson sub-market managed the highest RevPAR increase, at 5.2 percent, while the South/Airport market turned in the worst performance at �5.1 percent. Among the price segments, the luxury hotels performed best, with a 2.6 percent increase in RevPAR, while at the mid-price hotels RevPAR dropped by 2.3 percent. Metropolitan Phoenix Hotel Transactions Investor interest in hotels slowed down in 2000, following a decline in transaction activity in 1999. Factors influencing the decline include declining market performance, perceptions of an overbuilt market, tightening of the capital markets, a smaller pool of qualified buyers, and limited available product. The number of hotel transactions in 2000 was the lowest in the past ten years and well below the peak established in 1998. However, the total transaction value ($377 million) and average sales price per room ($258,374) eclipsed the previous high established in 1994. The latter numbers, however, are heavily distorted by the sale of the Arizona Biltmore, which represented 89 percent of the total value of the transactions in 2000. It sold for $335 million ($458,904 per room), making it, by far, the most significant transaction to occur in the market since the sale of the Phoenician in 1994 and setting metropolitan Phoenix�s per room value bar at a new level The remaining six sales during 2000 had to do with six limited-service properties. The total value of these transactions was $42.5 million, or $58,118 per room. This is similar to the per room value achieved in 1999, but well below the $89,000 per room value captured in 1998. Hotel transaction activity in Maricopa County between 1994 and 2000 is detailed below. Metropolitan Phoenix
|